

At the time of writing, the Ethereum price prediction is moving above the $2,000 price mark as it is currently changing hands at $2,120.
Ethereum (ETH) Statistics Data:
- Ethereum price now – $2120
- Ethereum market cap – $256.5 billion
- Ethereum circulating supply – 120.7 million
- Ethereum total supply – 120.7 million
- Ethereum Coinmarketcap ranking – #2
ETH/USD Market
Key Levels:
Resistance levels: $2800, $300, $3200
Support levels: $1500, $1300, $1100

ETH/USD has once again touched the $2136 mark as the number two crypto faces the path of development since a couple of days ago but this can only be confirmed if the market price remains above $2000. However, the Ethereum price is hovering below the 9-day and 21-day moving averages at $2,120 with 3.29% gains in the last 24 hours.
Ethereum Price Prediction: Ethereum (ETH) May Gain More
As the daily chart reveals, traders can observe that since the beginning of this month, the Ethereum price has not been able to display the strong bullish momentum. Nevertheless, the good thing is that the coin is not decreasing drastically. Therefore, the Ethereum price needs to stay above $2000 consistently for the next few days to regain the proper bullish momentum as the technical indicator Relative Strength Index (14) recovers from the oversold region.
However, at the time of writing, the Ethereum price only needs to conquer a few crucial resistance levels of $2300 and $2500 to stay comfortably at the top. Now, if the coin closely manages these levels well, then it could reach the potential resistance levels at $2800, $3000, and $3200 respectively. On the downside, if the bears wish to maintain their drive, ETH/USD may likely drop below the lower boundary of the channel, any further bearish movement could drag it to the critical supports at $1500, $1300, and $1100 respectively.

Against Bitcoin, Ethereum is consolidating below the 9-day and 21-day moving averages. The Ethereum price is changing hands at 6876 SAT as the technical indicator Relative Strength Index (14) moves to cross above the 40-level.
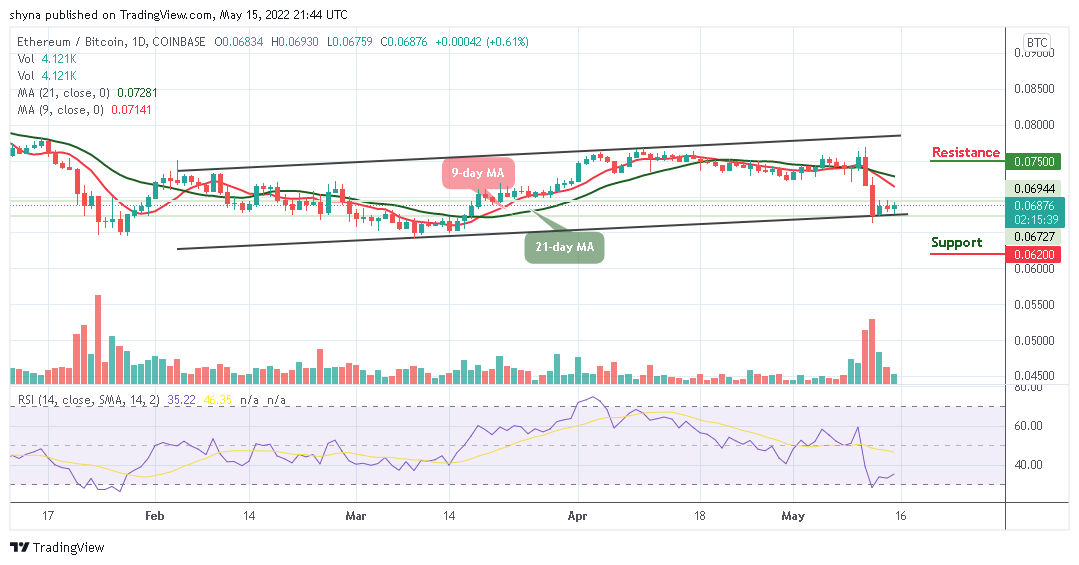
However, the daily chart reveals that buyers are likely to have the day as the resistance levels to be reached could be 7500 SAT and above. Conversely, a lower sustainable move below the lower boundary of the channel may cancel the bullish pattern and could attract new sellers to hit the support at 6200 SAT and below.
Looking to buy or trade Ethereum (ETH) now? Invest at eToro!
68% of retail investor accounts lose money when trading CFDs with this provider
