

There’s a good reason Warren Buffett, CEO and Chairman of Berkshire Hathaway (NYSE:), is often referred to as ‘the Oracle of Omaha’. The legendary investor is highly respected for his market acumen and much sought after for his ideas on strategic market positioning.
Since he became CEO of Berkshire Hathaway in 1965, Buffet’s investments have transformed the former insurance company into a more diversified enterprise and created about $690 billion in value. That’s an average return of 20.1% every year. Another way of looking at Buffett’s results thus far: his efforts provided a more than 3,600,000% boost to BRK’s valuation.
Because of this success, investors view Berkshire Hathaway as an economic bellwether, perhaps even an equity market pacesetter since Buffet’s business savvy puts him ahead of the curve, generally on the upside. As such, if Berkshire shares are doing poorly, it probably doesn’t bode well for the stocks of companies that are managed with less skill.
So how is Berkshire Hathaway doing? The monthly chart still looks relatively positive:
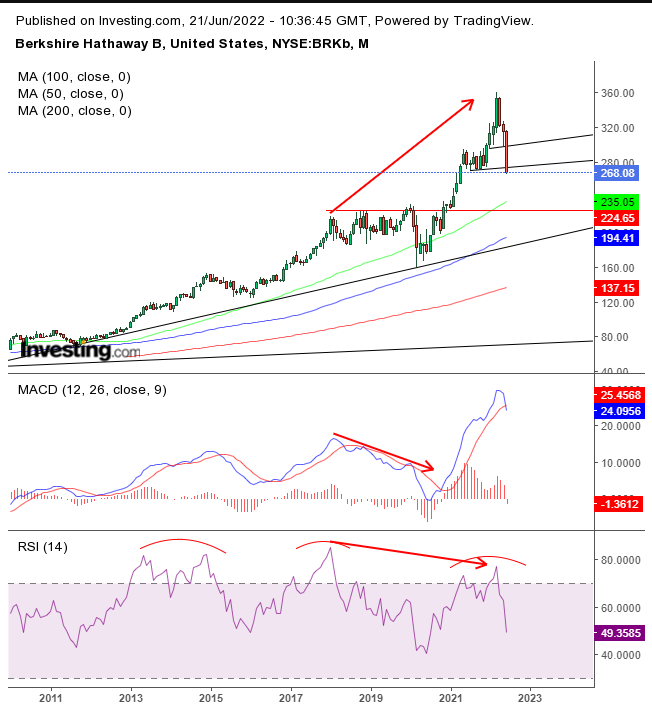
Over the long term, BRKb shares are up—like the rest of the market. However, BRKb has entered a bear market, having fallen 25% since its all-time closing high of $359.57 on March 28 of this year.
While the peaks and troughs along with the trendline are still rising, both momentum and price-based indicators are now providing bearish signals. The Moving Average Convergence Divergence (MACD) provided a negative divergence—the most potent signal from this indicator—when the gauge fell in contrast to the rising price between February 2018 and April 2022.
Also, the MACD’s short MA fell below the long one, demonstrating that current pricing is weakening. The RSI provided the same negative divergence, plus, it might be forming a Triple Top.
Such signals on the monthly chart suggest a possible break of the very long-term trend. Does the weekly view confirm this?
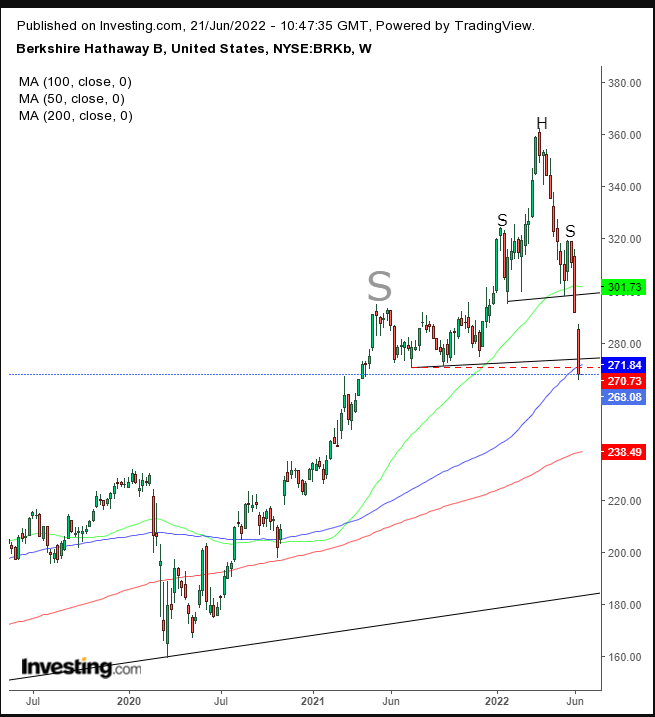
The price completed an H&S top, which included a drop through the 100- and 200-Weekly MAs. We think there’s a good chance the stock will rebound from this point on the support of the 100 WMA, which barely dipped below that measure, and the July 2021 low.
Such a move would be consistent with the follow-up dynamics of topping, via a Return Move. It would signal that investors are covering shorts, dip buyers entering longs, testing the supply’s endurance.
Such a price move would also be consistent with the development of a much larger H&S top, of which our already completed H&S is the head. These up-and-down moves would be consistent with bear market activity, since freely traded assets never fall in a straight line.
The 2008 sell-off occurred over 12 months, during which the market was down for eight months but rose for four months. The 2000 crash spanned 25 months: it fell during 16 of those months and rose during nine.
So is the stock heading higher or lower next?
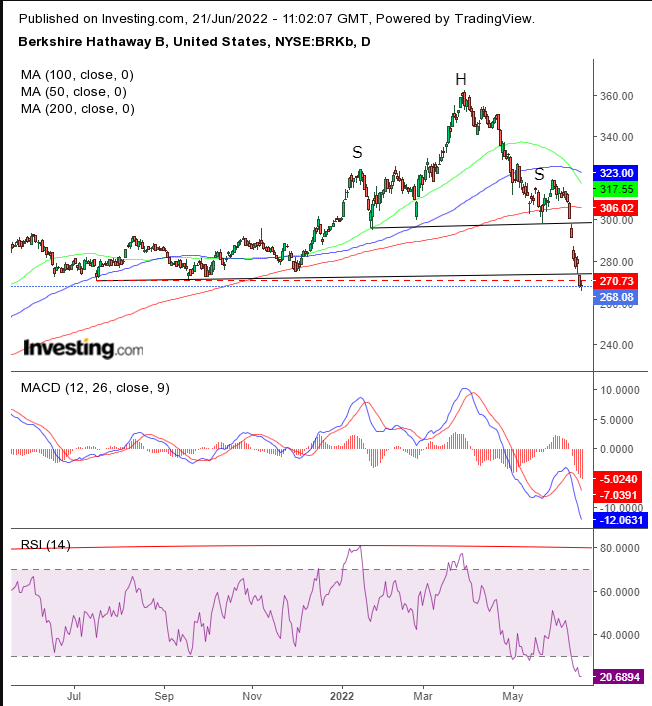
Via the daily chart, a closeup of the H&S top and the larger H&S is easier to see. In this view, it’s clear that the 50 DMA crossed below a falling 100 DMA for a particularly bearish cross as it heads towards the 200 DMA, which is also beginning to fall.
However, the most oversold RSI and MACD since February and March 2020 could enable a corrective rally before a continued sell-off.
Trading Strategies
Conservative traders should wait for the price to execute a return move to retest the H&S’s integrity before committing to a short position.
Moderate traders would wait for a bounce for a better entry if not for confirmation.
Aggressive traders could enter a long contrarian position, counting on an upward correction, before joining the rest of the market with a short. A strict trading plan is crucial. Here are generic examples:
Trading Sample 1 – Aggressive Long
- Entry: $267
- Stop-Loss: $265
- Risk: $2
- Target: $287
- Reward: $20
- Risk-Reward Ratio: 1:10
Trading Sample 2 – Short Position
- Entry: $295
- Stop-Loss: $300
- Risk: $5
- Target: $275
- Reward: $20
- Risk-Reward Ratio: 1:4

