Investors have been processing high reports, rising interest rates, surging energy, commodity, and real estate prices.
So, what is the market saying about which markets investors have favored the last couple of years vs. where are they putting their money right now?
A way to determine this is to plot the indices and then see how they stack up against each other. Price data should also be viewed and analyzed in a multi-timeframe environment: short-term, medium-term, and long-term.
As traders or investors, we know it’s essential to determine if a market is in a bull, bear, accumulation, or distribution phase. Additionally, we want to understand how the market we’re trading is performing compared to its peers.
The following charts provide snapshots of how the SPDR S&P 500 ETF (NYSE:) is doing compared to the other US and global stock indices.
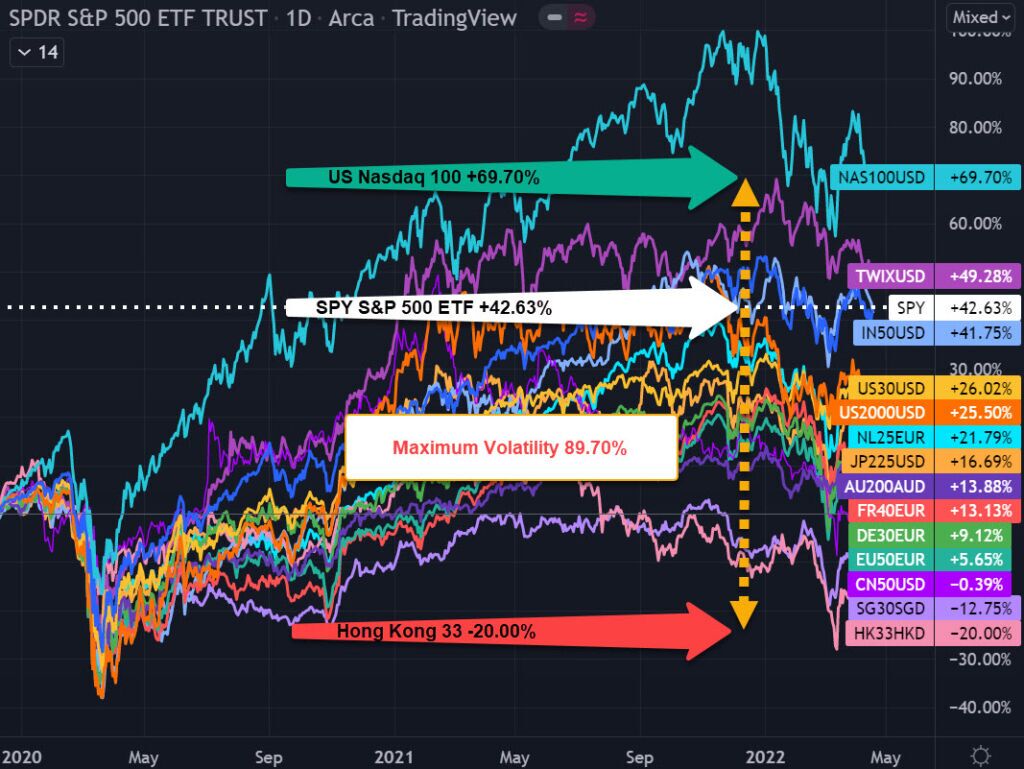
The year-to-date chart shows us a maximum spread of 15.73%. This is simply the difference between the highest stock index, Australia 200 +1.18%, vs. the lowest stock index, US -14.55%.
Australia’s market has recently done well due to its strong energy and commodity interests which in turn has contributed to the strengthening .
SPY YEAR-TO-DATE DAILY: MAX VOLATILITY 15.73%
At first, the volatility spread doesn’t seem that significant, but over time, it can be substantial. This is one of the reasons why our team continually tracks global money flow according to each country’s stock index and other types of markets and asset classes. Our quantitative trading research is crucial in determining which markets to trade and how to employ trading capital efficiently.
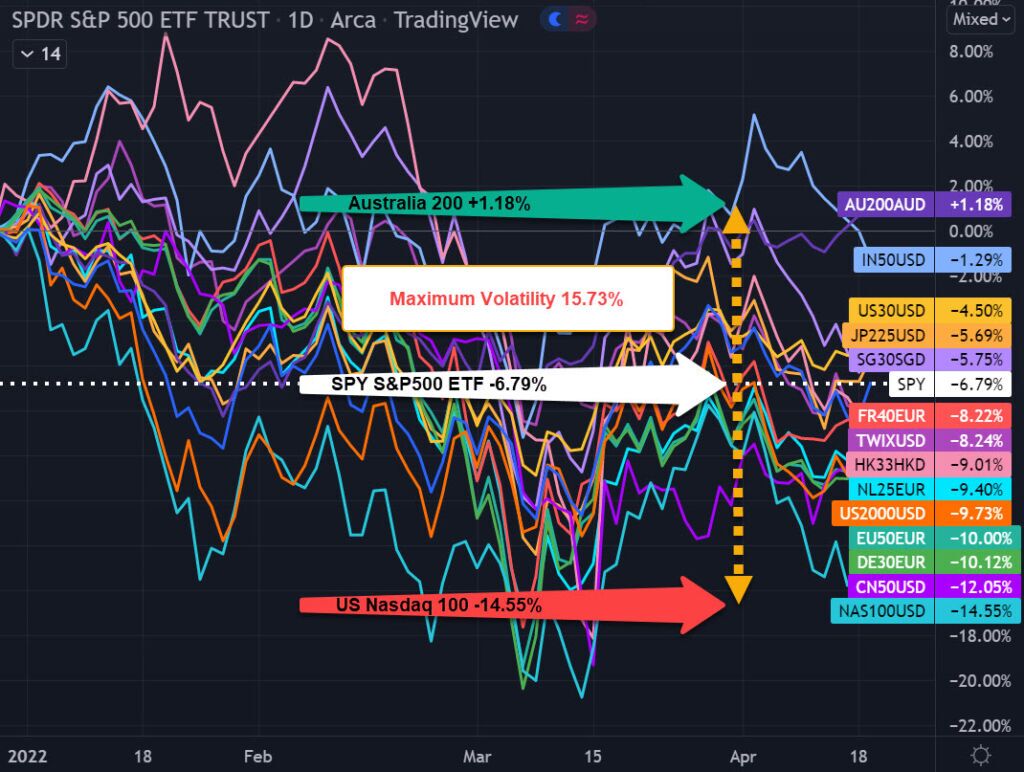
This maximum volatility spread during 2021-2022 is 44.42%. The highest stock index, the (+23.75%), vs. the lowest stock index, (-20.67%). The Hong Kong and China stock markets have been plagued with numerous COVID issues in 2020, 2021, and 2022.
SPY 2021-2022 DAILY: MAX VOLATILITY 44.42%
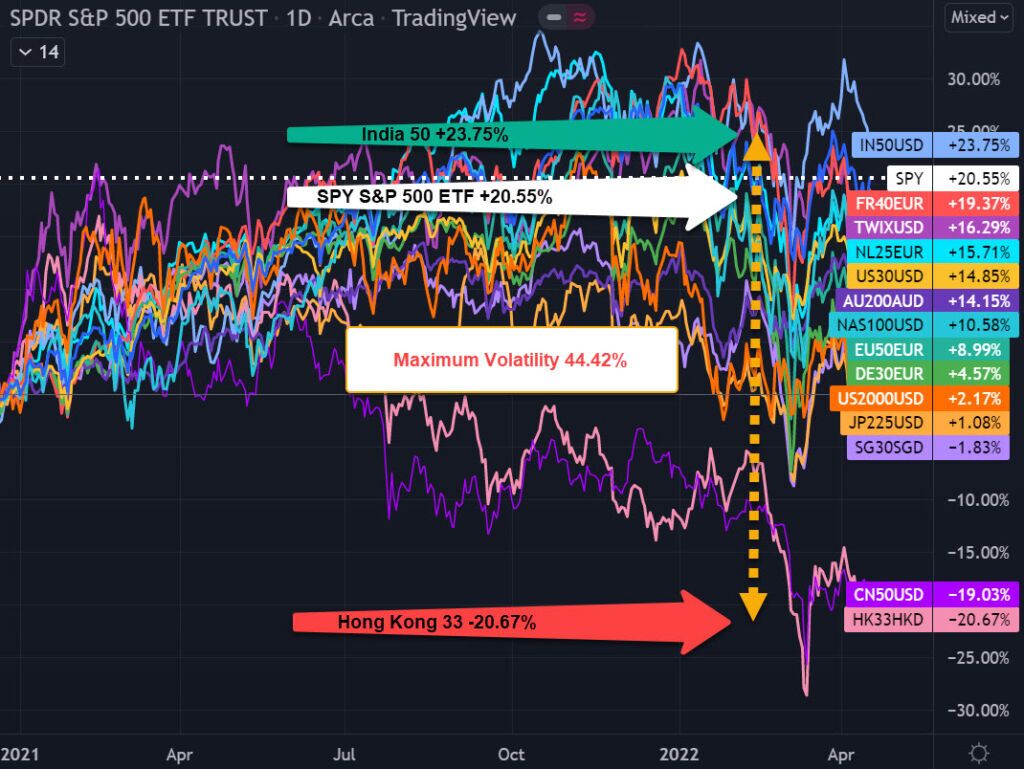
Now we can take a longer-term view of the past 2+ years covering COVID before and after. We notice that the NASDAQ 100 is the overall leader despite its recent negative performance in 2022.
This maximum volatility for 2020-2022 is 89.70%. The highest stock index, US NASDAQ 100 +69.70% vs the lowest stock index Hong Kong 30 -20.00%.
SPY 2020-2022 DAILY: MAX VOLATILITY 89.70%