

This article was written exclusively for Investing.com
- US inflation at generational highs
- Eurozone CPI at record highs
- Equilibrium level of inflation may have shifted higher
This past week, once again, saw the highest inflation prints in a generation and a half. I think I might start talking about what we are seeing in units of “generations,” since “41 years” seems both overdone and underappreciated.
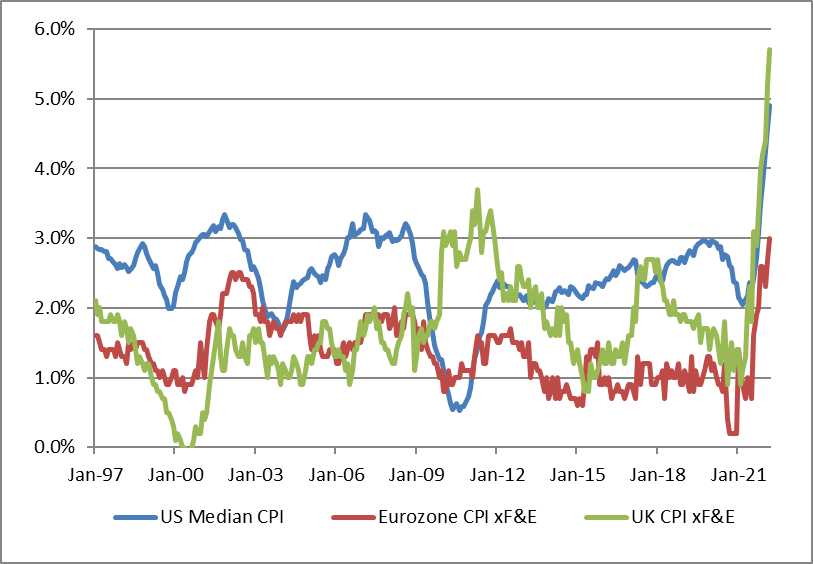
The last time printed at 8.5% or above in this country was in 1981. The last time printed at 6.5% or above was in 1982. Median CPI has never printed as high as this month’s 4.91%, because the Cleveland Fed only started computing the figure in 1983. When we last saw inflation like this, Mohammed Ali was still boxing and AT&T was still Ma Bell. They were still making DeLorean cars. Michael Jackson’s Thriller had not yet been released.
If none of those items means anything to you, then thank you—that’s exactly my point. Inflation was something the old folks talked about. Literally half of all Americans living today have never seen inflation this high. (Source: US Census, data here.)
Nor is this economic death rattle confined to the US only. for the Eurozone is at record highs (since the Eurozone only dates to 1999) and , meaning Median CPI in the UK is higher than both US and EZ (see chart, source Bloomberg).
Taking a Step Back…
Notice that all three lines in the chart above, largely uncorrelated previously, are highly correlated now. Even during the global financial crisis, UK inflation rose while it declined in Europe and the US. So why are the uncorrelated now becoming correlated?
Well, when money growth is low and steady, relative inflation rates are determined partly by relative exchange rate movements and partly by ‘noise’ that is big enough to notice when inflation otherwise is placid. When the appreciates versus , the US ‘exports’ some of its inflation to the U.K., and vice versa, but there are also country-specific vagaries that can make a difference.
The fact that all of these lines are moving in concert now shows that all currencies are losing value together. Relative FX movements are comparatively unimportant when we are talking about inflationary pressures an order of magnitude higher than they have been for the last generation. Countries aren’t changing the size of their relative slices of the inflation pie—the entire pie is getting a lot bigger so everyone is getting a bigger slice.
The cause of that increase in the inflation pie is obvious. The US led the way with extraordinary increases in government spending that, importantly, were financed by the Federal Reserve. If deficit spending is not financed by the monetary authority, then the spending of the government is offset to a large degree by the decline in spending by the investors who are buying the government’s bonds. Dollars in, dollars out.
But when the Fed prints the money to pay for government spending, that system doesn’t balance. Since the government isn’t taking money from taxpayers or investors through explicit taxation or bond sales, they have to take it through inflation. This is not rocket science. Milton Friedman (listen to my “interview” of him here) was talking about it two generations ago.
The fascinating thing is that even though the US spent oodles more money than any other nation, and US grew much more than the money supply of any other region, inflation is hitting everywhere. That’s partly because liquidity is fungible: a flood in my yard likely causes your yard to become muddy too. Money works the same way.
(Japan right now is a special case, but the 9% decline in the over the last month will cause it to get a bit muddy soon).
The fact that half of all Americans have never seen inflation at this level has implications for investment markets. Market-based measures of long-term inflation expectations, such as 10-year inflation breakevens, do not yet reflect the probable circumstance that the equilibrium level of inflation has shifted semi-permanently higher.
Ten-year breakevens are currently at 2.91%, and only 2.78% one year forward (that is, 10 years from early 2023 to early 2033), which is consistent with the Fed’s target at 2.25% or so. Investors cannot even imagine that inflation could stay elevated above 4% for several years and refuse to price it. Similarly, multiples continue to be extremely rich and the tired meme that “inflation is good for equities”—a blatant falsehood easily punctured by reflecting on the performance of stocks in the 1970s—has been making a comeback. For now.
It is not necessarily a bad thing that young investors are not burdened with the old ways of thinking about value in an economy where the value of the monetary unit is weak and uncertain. It is possible that everyone from Graham and Dodd to Dr. Doom was just wrong about the effect of inflation on equities and that the historical tendency of stocks to do very poorly in such periods was a mistake (as Modigliani thought) and is being corrected now. But if they are wrong, it will be a hard discovery for the whippersnappers at the hands of the wizened.
This coming week, the economic data is decidedly second-tier although I’ll be watching (Consensus: 5.80mm SAAR) on Tuesday and especially the median sales price. As the chart below (Source: Bloomberg) illustrates, home prices are still appreciating at better than 15% y/y.
This is still a rate comparable to that at the peak of the housing bubble in 2005-06, even though it is off the highs. To be fair, interest rates are still a lot lower now than they were then, and inflation is a lot higher. As long as home prices continue to streak higher, rents (a key component of CPI) will also continue to rise strongly. It can’t last forever at this pace.

Beyond the economic data, I’m watching liquidity in the Treasury market. Bid/offer spreads have been bigger and sizes smaller recently. With Treasury rates rising to near 3%, and 10-year real interest rates rising to near 0%, and lots of volatility in commodities markets, speculative risk budgets are likely under some pressure.
There is still plenty of liquidity sloshing around out there, but that doesn’t mean it is all at our service.
Michael Ashton, sometimes known as The Inflation Guy, is the Managing Principal of Enduring Investments, LLC. He’s a pioneer in inflation markets with a specialty in defending wealth against the assaults of economic inflation, which he discusses on his bi-monthly Cents and Sensibility podcast.
