

CAD CPI Key Points:
- The Canadian Yearly CPI Actual 6.9% Vs Previous 7% (Forecast 6.8%)
- Canadian Core CPI YOY Actual 6% Vs Previous 5.8%.
Recommended by Zain Vawda
Introduction to Forex News Trading
Canadian CPI rose 6.9% YoY in September showing a slowdown from a 7% print in August. This marks a third consecutive monthly slowdown in headline inflation. The drop came courtesy of a fall in gasoline prices while food prices continued to accelerate. On a monthly basis, the CPI edged 0.1% higher while core inflation YoY jumped to 6% compared to August’s print of 5.8%.
Customize and filter live economic data via our DailyFX economic calendar
The Bank of Canada (BoC) seemingly benefitted from front loading rate hikes as inflation slowed down in both July and August with the BoC aiming to ensure inflation doesn’t become entrenched. However recent comments by Governor Tiff Macklem seem to suggest that any hope for a pivot may be misplaced. Governor Macklem stated that there is more to be done as inflation will not fade away by itself.
Governor Macklem further weighed in on the recent uncertainty in financial markets indicating that it would not sway the BoC from fighting the immediate threat, which according to him remains inflation. The BoC has led the rate hiking cycle amongst its peers with 300bp of hikes since March as markets price in a further 75bp before the end of the year.
Market reaction
USDCAD Two-Hour Chart
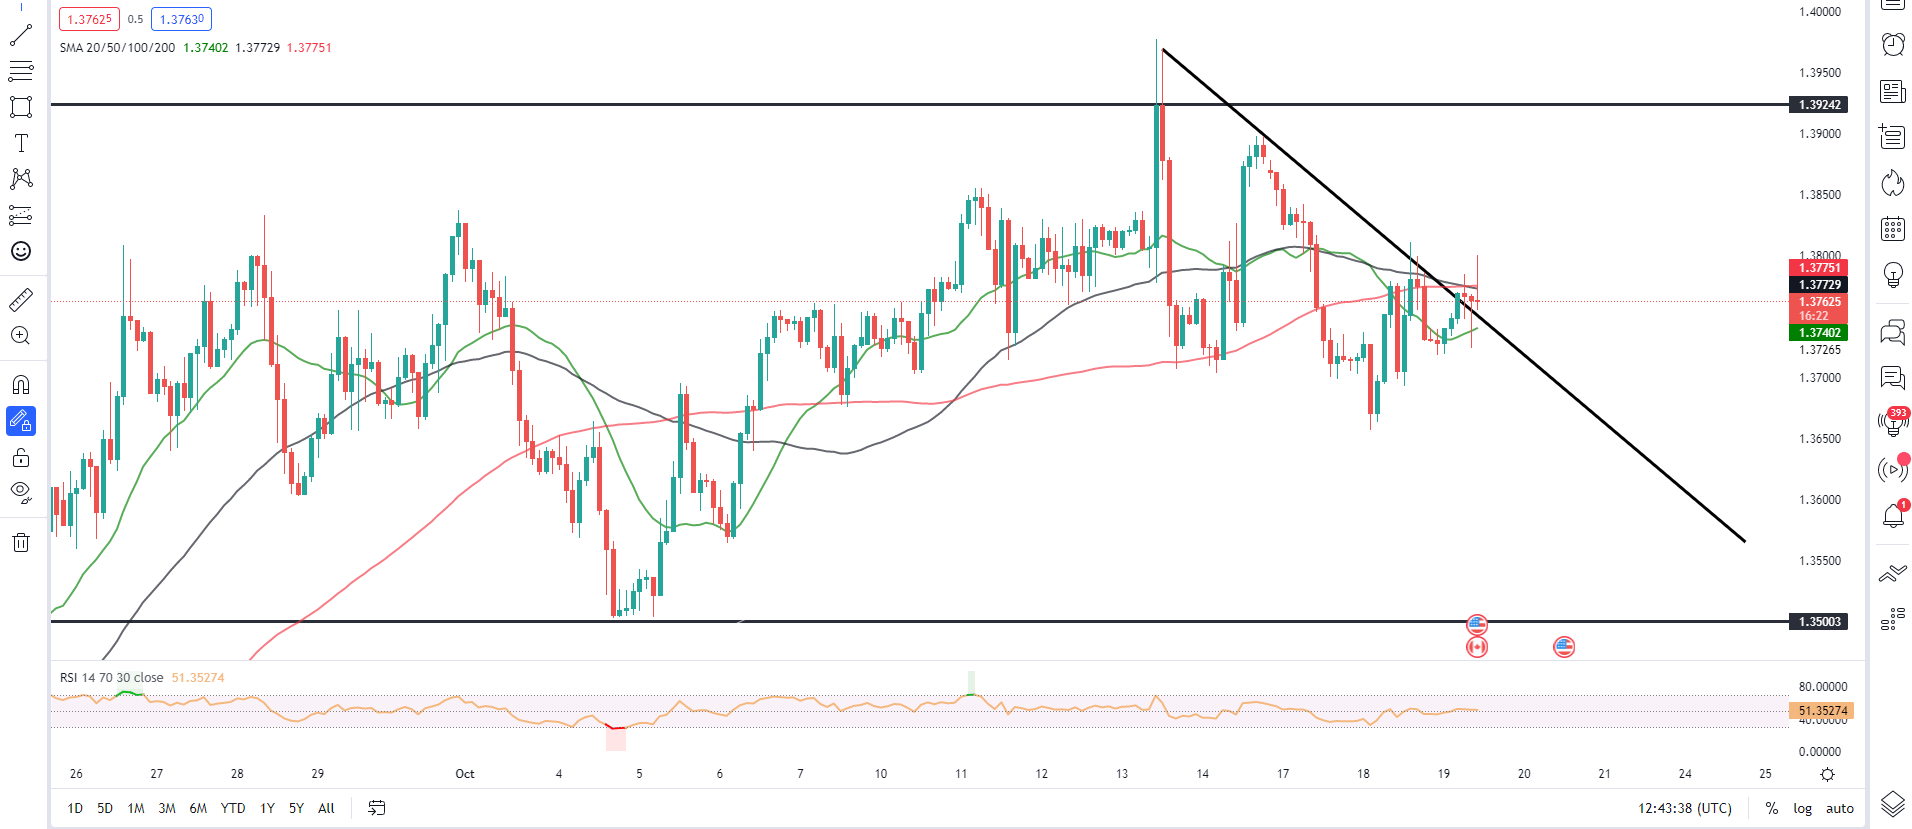
Source: TradingView, prepared by Zain Vawda
Initial reaction to the data release saw USDCAD fall around 20 pips. The break of the descending trendline on the 2H chart may hint at one more push higher before the bears return.
On the larger timeframes the pair remains overextended and in need of a pullback. The Canadian dollar has lost around 8% to the greenback in the past two months before finding resistance at the confluence area around 1.3950.
Introduction to Technical Analysis
Technical Analysis Chart Patterns
Recommended by Zain Vawda
— Written by Zain Vawda for DailyFX.com
Contact and follow Zain on Twitter: @zvawda

