

Both growth and value stocks have advantages.
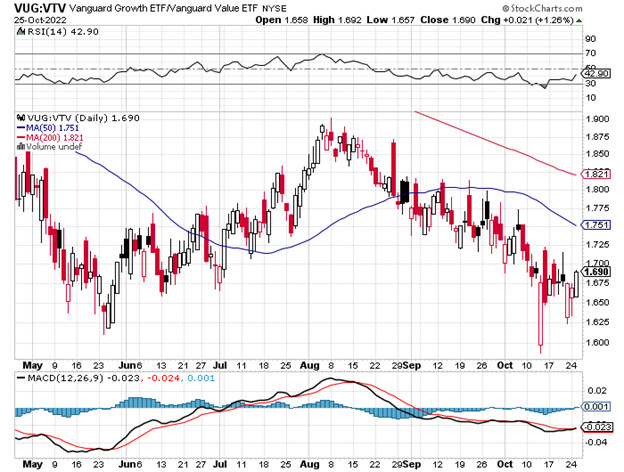
VUG:VTV Daily Chart
For years, investors have debated which investment strategy is better: growth or value.
The chart above shows that growth stocks had a great day Tuesday.
Over the last few weeks, value, as represented by the Vanguard Value ETF (NYSE:), has outperformed growth defined by the Vanguard Growth ETF (NYSE:).
Up until this week, value was beating growth.
The valuation gap or spread between these valuations is wide, as defined by VTV and VUG.
Both value and growth sides offer statistics to support their respective investment cases.
So, which is the better option now and in a new era of higher inflation? Which strategy — growth or value — will likely produce higher returns?
Let’s take a closer look at the pros and cons of each to find out which is the most attractive now.
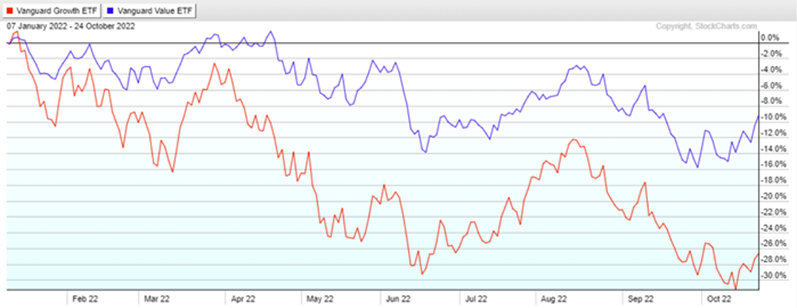
The debate over value vs. growth stocks is never-ending, and the chart above shows how growth and value equity have interacted over the year to date, as represented by VUG and VTV.
Growth investing seeks to profit from companies growing at an above-average rate.
These companies usually have solid fundamentals and are expected to continue growing at a rapid pace.
Growth stocks, in general, have the potential to perform better when interest rates are falling, and company earnings are rising.
However, they may also be the first to be punished when the economy is cooling.
While this strategy can produce high returns, it also comes with higher risks.
Value investing, on the other hand, focuses on finding undervalued stocks that have the potential to go up in price.
These stocks may be out of favor with investors or in industries that are currently facing challenges.
Value stocks, often stocks of cyclical industries, may do well early in an economic recovery but are typically more likely to lag in a sustained bull market.
This strategy tends to be less risky than growth investing but can also produce lower returns in the short term.
ETF Summary
S&P 500 () Now that it cleared 380 must hold with 400 next level to watch
Russell 2000 () Rallied right to the 200-WMA at 179 and stalled-either clears or we watch 174
Dow () 322 resistance now as this is the only index above the 50-DMA and must hold 316
Nasdaq () 274 now support, 290 resistance
(Regional Banks) Back looking at the 63.00 resistance level
(Semiconductors) Also right to its 200-WMA at 190 must clear
(Transportation) Needs more work but looks ok if holds 207
(Biotechnology) A push through 125 should get this to 130.
(Retail) 62 is the weekly chart resistance while the best sign is the hold of longer-term support at 55.00

