

It’s been a rough year for stocks but I don’t think that the low is in just yet. Maybe something along those lines happens in Q3, some type of bottoming effect, but I’m not anticipating as such from where we’re at now.
The Fed has shifted and at this point, that seems fairly obvious. What makes me retain a bearish approach towards equities is how there’s still so much ‘buy the dip’ mentality showing around global markets. And while the Fed has already made some inroads towards tighter policy, we still have yet to see any significant response with inflation which means the Fed is going to have to keep hiking until something begins to shift. And at this point there simply is a lack of evidence suggesting that this may be near and, if anything, there’s evidence pointing in the other direction with impact still set to show from the lockdown in China and the ongoing war in Ukraine.
The effects of higher rates are also likely to bring a larger toll on emerging markets, which could, in turn, bring additional impact to US equities that like to sell products and derive revenue from these economies. Combine that with an expected pinch in Europe as inflation scales higher and there’s not a lot of optimism on the horizon for equities and at this point stocks are still quite overvalued compared to historical norms.
I’m going to retain my bearish stance on US equities into Q3, specifically looking at the Nasdaq and S&P 500. But, even the Dow brings some bearish potential into Q3 as prices have, so far, tested but not broken below, a critical set of supports straddling the 30k psychological level.
Dow Jones
There’s a major spot of support on the Dow Jones chart running from a Fibonacci level at 29671 up to another Fibonacci level at 30,109. In between those two, we have the 30k psychological level so this is a big batch of support on the Dow Jones chart.
And, just as it did in early 2021, this spot has so far helped to cauterize the lows as bulls have provoked a bounce. This has so far led to a mild bounce and that bounce may continue for a little while but, there’s resistance overhead at 31,393 and then another confluent zone around 32,500 that could prove as problematic for bears.
I think the support zone around 30k could give way in Q3. The next confluent support zone on my chart is around 27,459, which is a little over 10% away from current price, as of this writing.
Dow Jones Weekly Chart (2018-present)
Chart created with TradingView, prepared by James Stanley
S&P 500
For my Q2 top trade, one of the big sticking points in the S&P 500 was a confluent zone of support that was previously tested in Q1 but, by the end of the quarter, hadn’t yet given way. This confluent zone was between two Fibonacci levels at 4186 and 4211. It finally gave way in April before showing up as a resistance test in late May.
There was another confluent zone between two Fibonacci levels a little bit lower that ran from 3802-3830. This zone came in as support in mid-May and was broken-through in early-June. As of this writing, it’s coming back in as resistance.
At this point, the trend seems fairly clear and lower prices seem likely. The bigger question is timing as I’m writing this with a little more than a week before the end of Q2. But, this bounce may run for a little while longer as there’s still some open gap running above the 3900 level.
For Q3, I want to look for price to move down towards 3500, which is around the 50% mark of the pandemic move. This would be a loss of approximately 7.5% from current price and given the backdrop, it seems a reasonable support target. There is another more important zone, however, and that’s down around 3200. There are two Fibonacci levels straddling that price and that’s about -14.3% away. It would be a bit aggressive for a move in a single quarter but I’m not going to rule it out – instead, I’ll merely mark that as a support target that I think can come into play by the end of the year.
S&P 500 Weekly Price Chart (2018 – present)
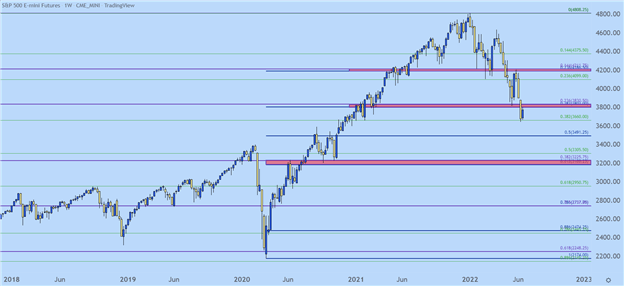
Chart created with TradingView, prepared by James Stanley
Nasdaq
The Nasdaq continues to show a more developed bearish trend and I think this will remain the case through Q3. While the S&P 500 is currently finding resistance at the 38.2% Fibonacci retracement of the pandemic move, the Nasdaq is finding resistance at the 50% mark of its own move around that same period of time. And while the S&P 500 has drawn down by as much as 24.32%, the Nasdaq has given up as much as 34% from the high set last November.
And this makes sense: With rates moving higher, the riskier tech-heavy index has become more vulnerable. And as rates continue to jump funding to companies will become more difficult and this is something that can continue to negatively impact higher-beta issues that populate the Nasdaq.
The next spot of support on my longer-term Nasdaq chart rests in the zone from 10,500-10,750, the former of which is the 61.8% retracement of the pandemic move. That’s a little under 10% from current prices and seems a reasonable support target for Q3. Should the move continue to develop, which given the drivers, it can, then a 10k print can’t be ruled out from the equation.
Nasdaq 100 Weekly Chart (June 2018 – present)
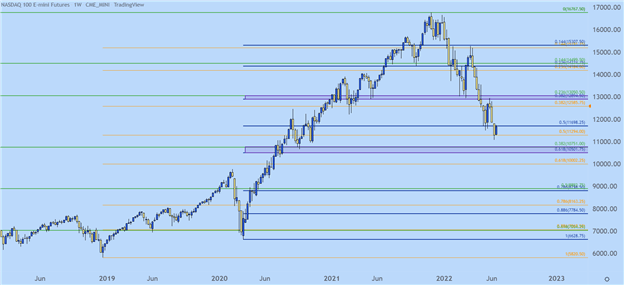
Chart created with TradingView, prepared by James Stanley

