

Up until last week, the ongoing correction in the I have been tracking using the Elliott Wave Principle (EWP), unfolded along a standard Fibonacci-based impulse pattern (SF-BIP). Only a few adjustments were needed for more than a month. Then by last week, the index had gone enough to the downside (see here) to consider the correction complete. It had done, technically, five waves lower since the March 29 bounce high. However, it decided to throw the proverbial “curve ball” one more time as it dropped below last week’s low. This drop adds complexity to the ongoing price action and adds additional evidence to the current price action since the all-time high is corrective. As I concluded last week, “I will have to revise my current POV on a drop below last week’s low,” which I will do in this update.
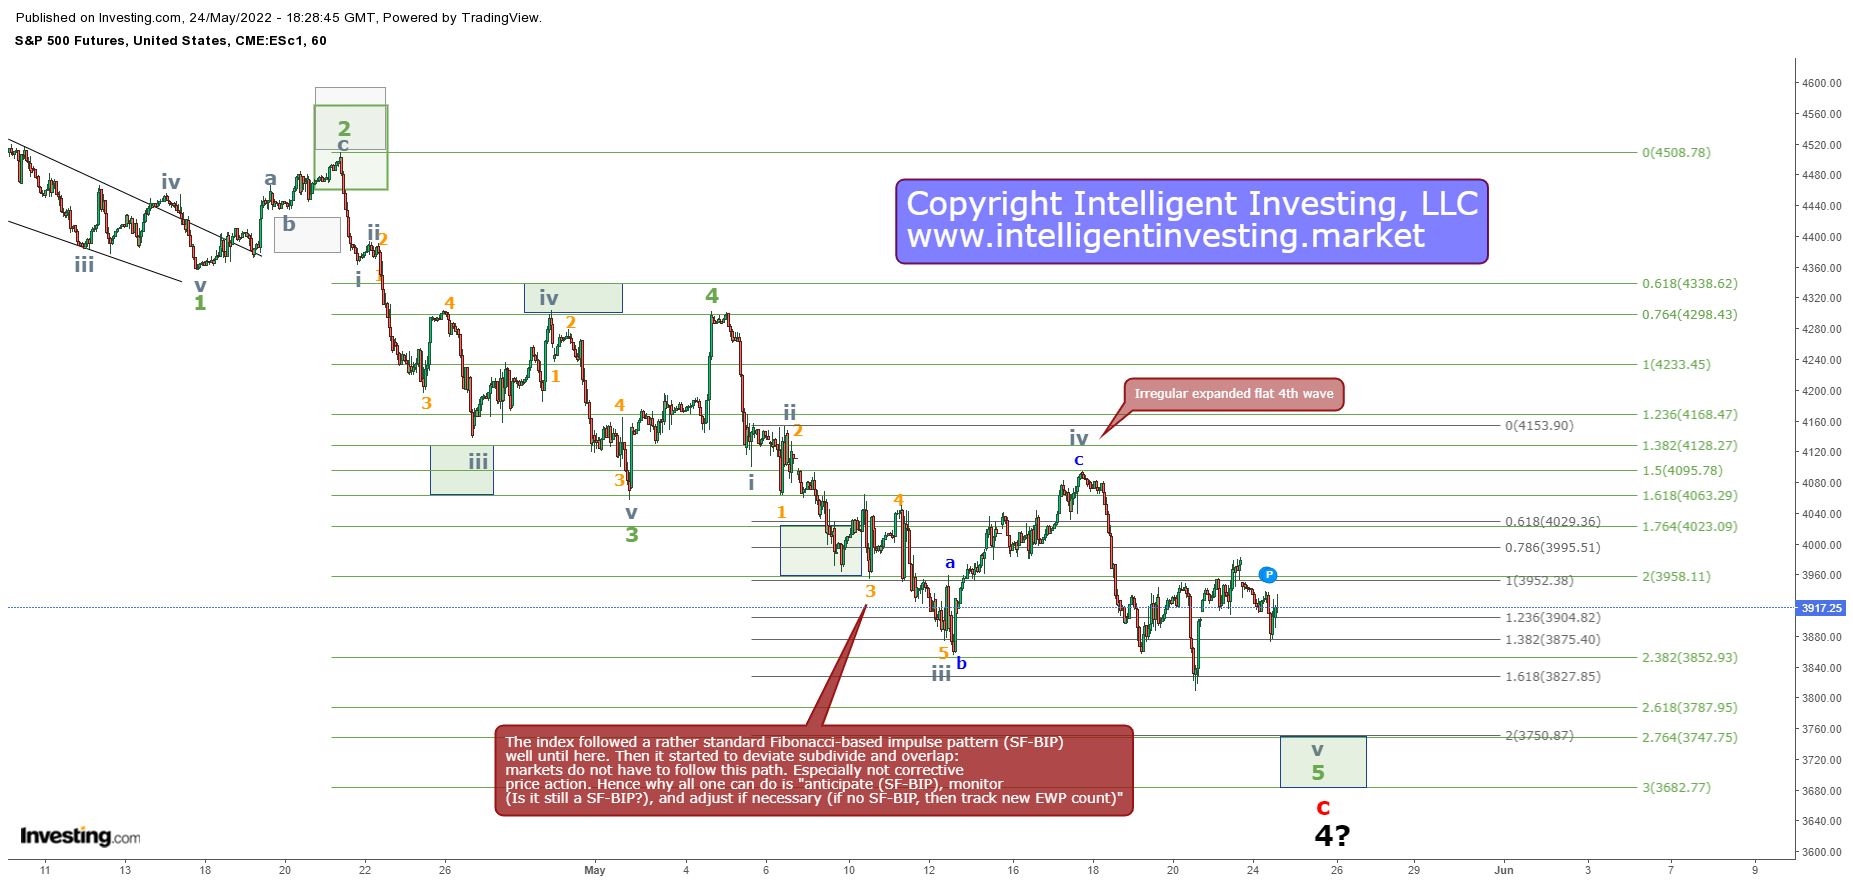
Figure 1: ES hourly candlestick chart with detailed EWP count and several technical indicators
No Five Waves Up
The rally into last week’s high was five waves up, but it came off a low made from three waves lower (see Figure 1: the blue a, b, c for the “irregular expanded flat 4th wave.” This pattern wrong-footed me, but I am only human and not infallible. It shows that if one misinterprets only four hours of price data, the outcome can be quite different, especially in corrections.
Figure 1 shows how the index, once again, reached the ideal third wave target Fib-extension in grey (minute). But, although the decline from last week’s high into last week’s low was not ideal from a five-waves impulse perspective, it sets a floor in the market.
Namely, If the index can hold around today’s lows, not break below last week’s low, and rally back above yesterday’s high, then it can start trying to fill in an impulse pattern to the upside.
But, if last week’s low does not hold, grey wave-v and the green minor-5 become increasingly more complex, i.e. like an ending diagonal. In that case, I will look for a low between ES_F3750-3680. I will then also adjust my EWP count for the entire decline from the ATH to a (very) complex double zig-zag correction (W-X-Y). It barely gets any harder than this and has undoubtedly caused me several headaches. But eventually, one can see the price action. It also shows that one can never know how a correction will unfold beforehand. One starts with a simple three-wave pattern (anticipate). Then, as more price data become available, one tracks it to see how these three waves unfold (monitor). Finally, as the markets continue to morph, the EWP is adapted if necessary to accommodate these new waves. Ideally, few adjustments are needed, but expect those to occur more frequently during corrections, as that’s the inherent nature of the corrective “beast.”
Remember what I always say: “All we can do is anticipate, monitor and adjust.” Most dismiss what they do not understand, but once we wrap our heads around this concept and how the EWP tracks the probabilities of possibilities because markets are dynamic, stochastic,and probabilistic, a wonderful world of understanding awaits.
Bottom line: Last week, all ingredients were in place for the S&P 500 futures to either “bounce to ideally ~ES_F4335+/-25 from where I expect a final c-wave lower to complete the correction at ~ES_F3750+/-25. Or, the index is working on an impulse to around ES_F4325+/-25, and I expect a wave-ii decline to around ES_F4125+/-50 before the wave-iii to a new all-time high kicks in. I will have to revise my current POV on a drop below last week’s low.” Last Friday’s drop lower forced me to revise my POV, and now the index is once again at a crossroads:
- Hold around today’s lows, a rally above yesterday’s high that targets ~ES_F4150, drop to ~ES_F4025, and rally to ~ES_F4200 for a more significant impulse path.
Or
- Drop below last Friday’s low targeting, ideally ES_F3750-3680, before we once again can start to look for another possible impulse to move higher.

