

S&P 500, FTSE 100 Prices, Charts, and Analysis
- S&P 500 – consolidating or overstretched?
- The FTSE 100 – rally remains in place for now.
The S&P 500 is trending lower in early European turnover as US trading desks come back online today after Monday’s Memorial Day holiday. The S&P 500 rallied sharply last Friday after the release of a key measure of US price pressures showed inflation slowing in May. The core PCE price index, the Fed’s favored measure of inflation, printed at 4.9% against a 5.2% prior reading in April. The bullish reaction seen across all US indices post the release may be more of a relief rally than a turnaround, especially after the heavy falls seen over the last few months. US President Joe Biden meets Fed chair Jerome Powell later today and any commentary coming out of this meeting will need to be monitored.
For all market-moving data releases and events, see the DailyFX Economic Calendar
The S&P 500 is now sitting on a prior support level at 4,138 and this looks at risk. Monday’s spinning top candle suggests that the recent rally may have run its course, leaving 4,106 and 4,060 as the next two levels of support.
The Ultimate Guide to Candlestick Patterns
S&P 500 Daily Price Chart – May 31, 2022
Retail trader data show 52.42% of traders are net-long with the ratio of traders long to short at 1.10 to 1. The number of traders net-long is 4.27% lower than yesterday and 25.12% lower from last week, while the number of traders net-short is 7.58% higher than yesterday and 42.49% higher from last week.
We typically take a contrarian view to crowd sentiment, and the fact traders are net-long suggests US 500 prices may continue to fall. Yet traders are less net-long than yesterday and compared with last week. Recent changes in sentiment warn that the current US 500 price trend may soon reverse higher despite the fact traders remain net-long.
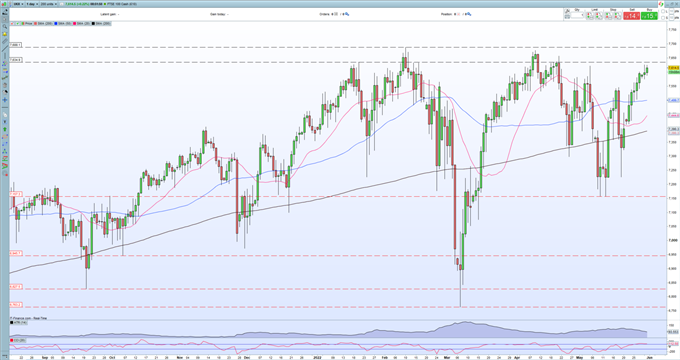
The FTSE 100 is now close to entering a zone of prior highs after adding nearly 500 points since May 12. The rally in the FTSE 100 comes against a troubled UK political and economic backdrop, but the trend higher remains in place. The 7,635-7,688 area will provide resistance and if the FTSE is to break above here it will need a strong economic driver to spark the move. The first level of support is seen around 7,540.
FTSE 100 Daily Price Chart – May 31, 2022
What is your view on the S&P 500 and FTSE 100 – bullish or bearish?? You can let us know via the form at the end of this piece or you can contact the author via Twitter @nickcawley1.

