

The first few months of 2022 worked out as anticipated in the 1Q’22 Top Trading Opportunities: the US S&P 500 outperformed the US Nasdaq 100; EUR/USD rates dropped below 1.1000; and the US Treasury yield curve (2s10s) moved towards inversion territory. While one of the major catalysts – Russia’s invasion of Ukraine and the ensuing calamity in commodity markets – wasn’t on our proverbial bingo card, the other drivers of price action were: central banks beginning to aggressively raise interest rates; and the end of fiscal stimulus.
It stands to reason that the main drivers of price action in 1Q’22 will remain in place for the duration of 2Q’22. The Federal Reserve is getting more aggressive with respect to raising interest rates, joining the chorus of many other major central banks in rolling back monetary easing. Governments are ‘tapped out’ when it comes to more fiscal stimulus. The COVID-19 pandemic continues to wane, although lockdowns are popping up sporadically (e.g. China). Even if Russia ends its war against Ukraine, the impact on supply chains will still be felt for several months ahead.
As far as 2Q’22 goes, these factors suggest that more volatility is ahead, as are concerns about deteriorating economic growth in developed economies. Risk appetite will ebb and flow before settling into a more bullish state later in the year.
US S&P 500 versus US Nasdaq 100 (ETF: SPY/QQQ; Futures ES1!/NQ1!) TECHNICAL ANALYSIS: DAILY CHART (March 2020 to March 2022)
Source: TradingView
When the 1Q’22 Top Opportunities were written, the S&P 500/Nasdaq 100 ratio (as measured by SPY/QQQ) was sitting at 1.19, and a move up to 1.29 was eyed early in the year. The ratio hit a high of 1.31 before peaking, and has been in a steady state of retracement as 2Q’22 dawns. The potential double bottom that formed against the 1Q’21 and 4Q’21 lows remains valid, however, suggesting that the rotation in stocks from growth to value is still in the early innings. The long S&P 500/short Nasdaq 100 trade is still favored; looking to initiate closer to 1.22 with a rally up 1.35 in the coming months.
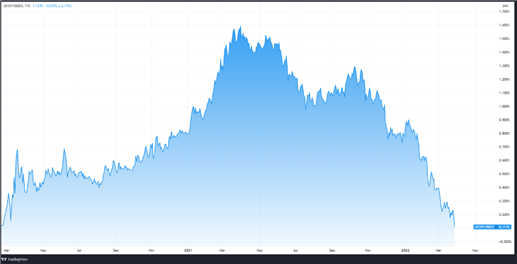
US 10-year Yield Minus 2-year Yield (2s10s) TECHNICAL ANALYSIS: DAILY CHART (March 2020 to March 2022)
Source: TradingView
The logic behind expecting a US Treasury yield curve inversion is simple: while the short-end of the US Treasury yield curve tends to see higher rates as the Fed pulls back stimulus, the long-end of the yield curve tends to come down as growth and inflation expectations – inherently embedded in the long-end – come down as reduced stimulus reduces economic potential.
It remains the case that a further flattening of the US yield curve is expected in the 2s10s spread, which will escalate recession fears for late-2022/early-2023. Yield curve inversions tend to not last very long, however, so this perspective has a limited shelf life (also, after yield curves invert, stocks tend to bottom).
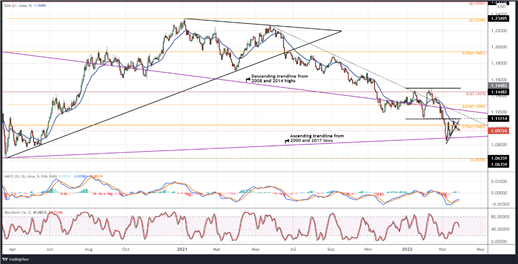
EUR/USD TECHNICAL ANALYSIS: DAILY CHART (March 2020 to March 2022)
Source: TradingView
We continue to remain of the mindset that the juxtaposition between the Federal Reserve and the European Central Bank will only grow over the coming months, and historically speaking, the spread between US and Eurozone inflation rates portends to a further weakening of the EUR/USD exchange rate. Yes, the ECB may raise rates later this year, but by that time, the Fed may have already raised rates by 100- to 150-bps. A return to the 1Q’22 low at 1.0806 is expected early in 2Q’22, followed by EUR/USD rates returning to the 2020 low at 1.0636 shortly thereafter (coinciding with the DXY Index move above 101.00 before topping).
— Written by Christopher Vecchio, CFA, Senior Strategist

