

Crude Oil Price Talking Points
The price of oil climbs to a fresh weekly high ($90.36) following an unexpected decline in US inventories, and crude may attempt to retrace the decline from the October high ($93.48) as it seems to be no longer responding to the negative slope in the 50-Day SMA ($86.44).
Oil Price Holds Above 50-Day SMA to Eye October High
The price of oil carves a series of higher highs and lows to trade back above the moving average, and expectations for less supply may keep crude prices afloat as the Organization of Petroleum Exporting Countries (OPEC) plan to “adjust downward the overall production by 2 mb/d” starting in November.
At the same time, developments coming out of the US may lead to higher prices as oil inventories contract 3.115M in the week ending October 28 versus forecasts for a 0.367M rise, and the advance from the September low ($76.25) may turn out to be a key reversal as signs of robust demand are met with the shift in OPEC production.
As a result, the price of oil may stage a further advance ahead of the next OPEC Ministerial Meeting on December 4 even though the most recent Monthly Oil Market Report (MOMR) warns of slowing demand, and it remains to be seen if the organization will respond to the US data prints as weekly field output remains below pre-pandemic levels.
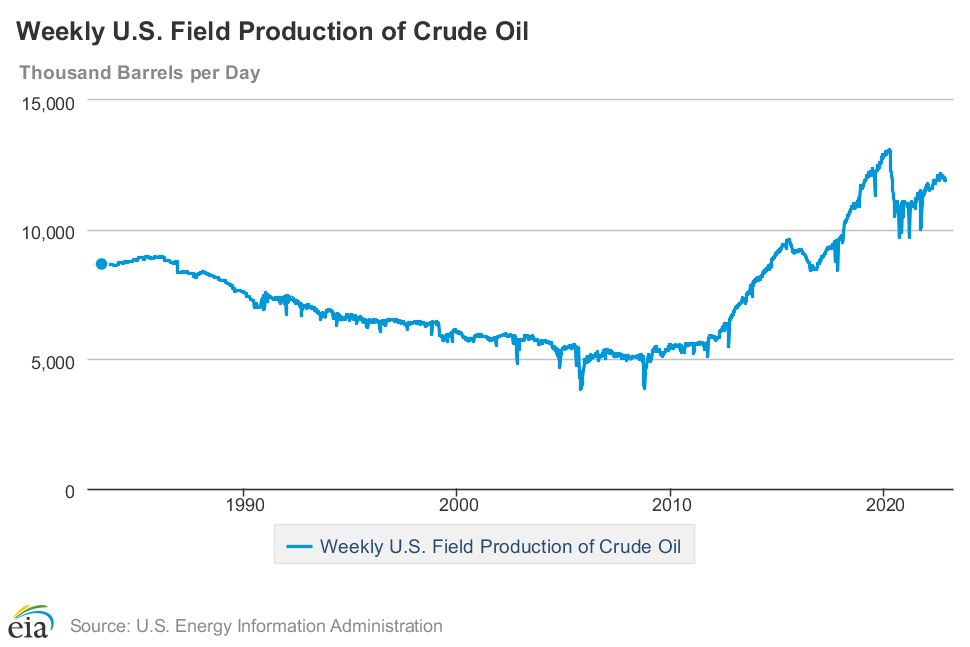
A deeper look at the figures from the Energy Information Administration (EIA) show US production narrowing to 11,900K in the week ending October 28 from 12,000K the week prior, and current market conditions may prop up the price of oil as OPEC cuts production.
With that said, recent price action raises the scope for higher crude prices as it carves a series of higher highs and lows, and the price of oil may attempt to retrace the decline from the October high ($93.48) as it seems to be no longer responding to the negative slope in the 50-Day SMA ($86.44).
Crude Oil Price Daily Chart
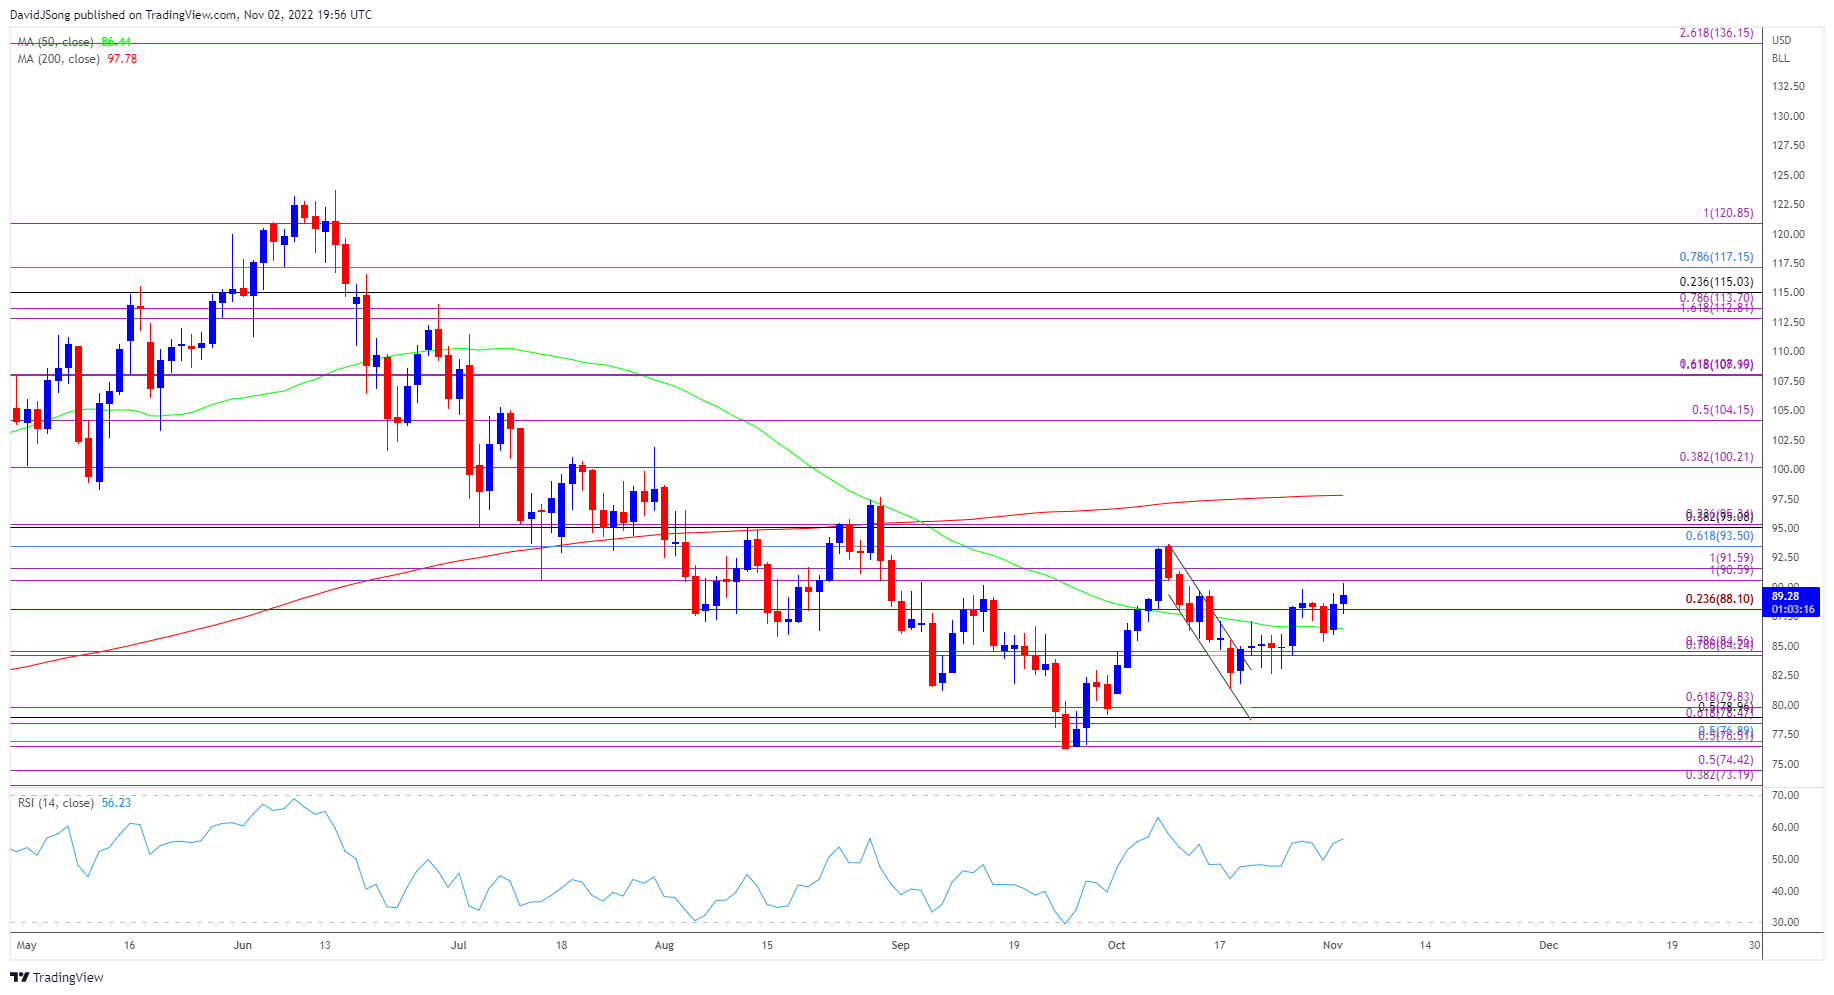
Source: Trading View
- The price of oil trades back above the 50-Day SMA ($86.44) after breaking out of a bull-flag formation, and crude may no longer track the negative slope in the moving average should the advance from the September low ($76.25) may turn out to be a key reversal.
- The recent series of higher highs and lows may lead to a break/close above the 90.60 (100% expansion) to $91.60 (100% expansion) region, with the next area of interest coming in around the October high ($93.48).
- A break/close above the Fibonacci overlap around $93.50 (61.8% retracement) to $95.30 (23.6% expansion) may push the price of oil towards the 200-Day SMA ($97.78), with the next area of interest coming in around $100.20 (38.2% expansion).
Trading Strategies and Risk Management
Becoming a Better Trader
Recommended by David Song
— Written by David Song, Currency Strategist
Follow me on Twitter at @DavidJSong
