

This article was written exclusively for Investing.com
The has fallen by nearly 30% in 2022, with no bottom in sight. The declines have come with good reason, primarily due to the being on a path to raise rates multiple times in 2022 and 2023, which has resulted in a significant increase in interest rates and falling earnings estimates.
Additionally, technical trends in the NASDAQ have been very weak and have shown very few signs of improvement thus far. Combining a weaker fundamental outlook and deteriorating technical trends helps explain the overall market weakness and why the all-time highs may not be seen for a very long time.
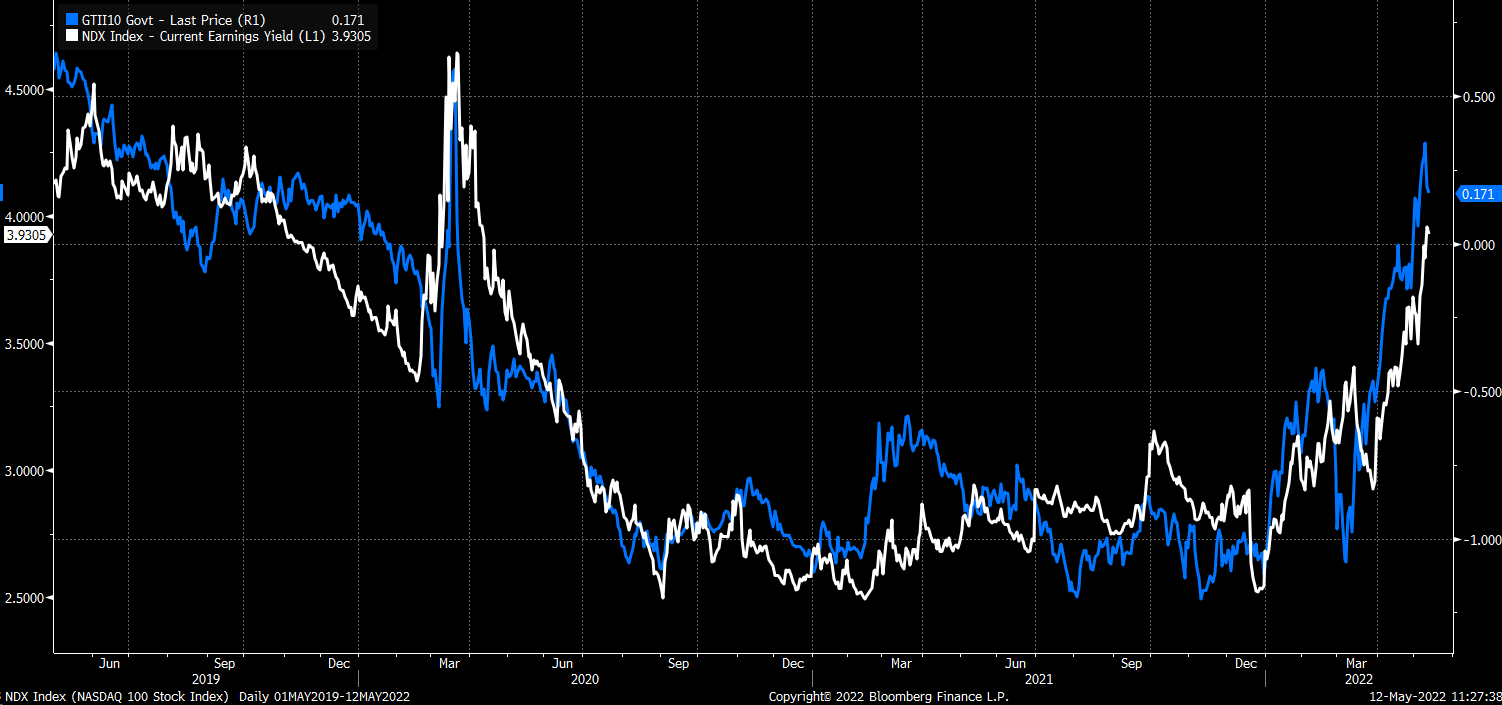
Rising rates, such as on the , have sharply increased in 2022, which have helped to bring the PE ratio of the NASDAQ 100 lower, and as a result, pulled the value of the index down. This is due to rising rates hurting the earnings yield of the NASDAQ 100 and pulling them higher along the way. The earnings yield is the inverse of the PE ratio, so the higher the earnings yield rises, the lower the PE ratio will fall.
Source: Bloomberg
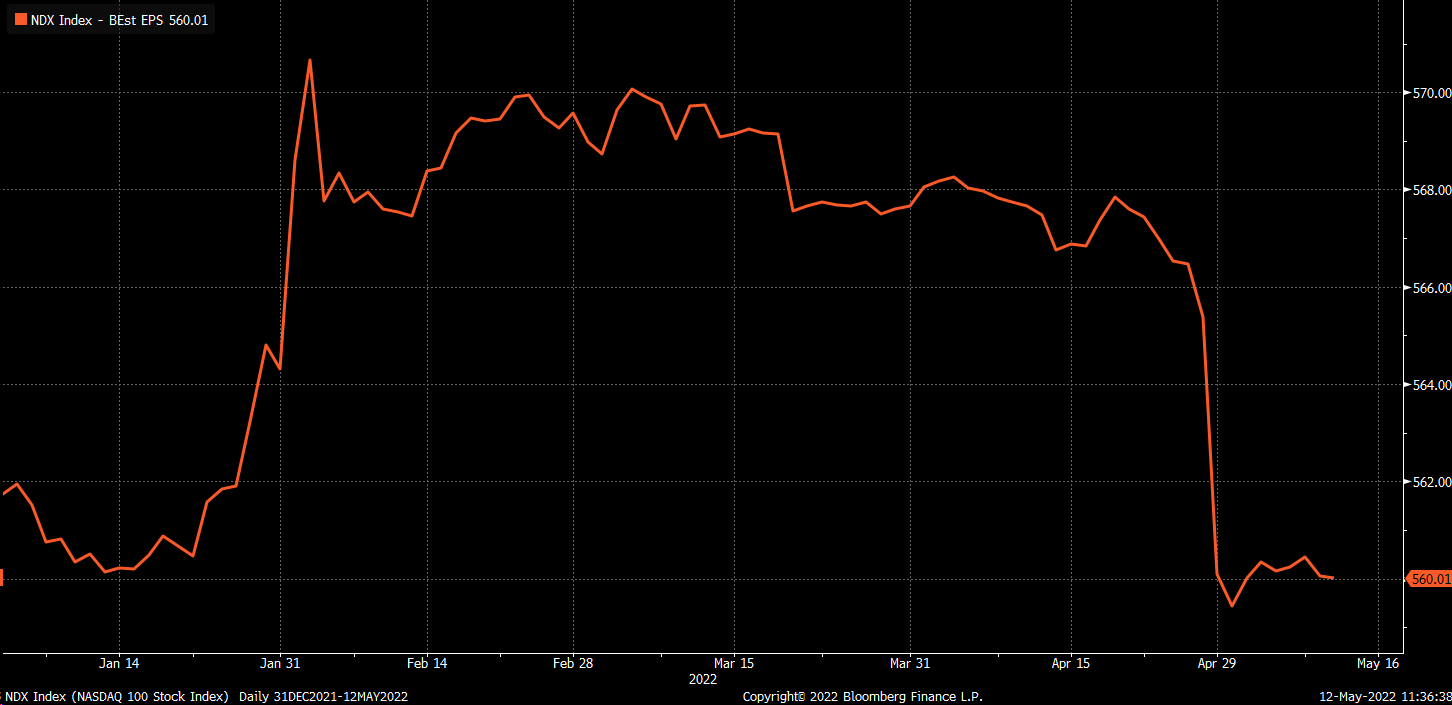
On top of rising rates, earnings estimates for the NASDAQ 100 have fallen dramatically since the start of 2022. In January, the NASDAQ 100 saw its earnings estimates climb to nearly $571 per share. Since then, earnings estimates have come down to $560, a drop of around 2%. It is not much in the grand scheme of things, but when PE multiples are falling, a decline in earnings estimates can lead to a lower valuation for the index.
Source: Bloomberg
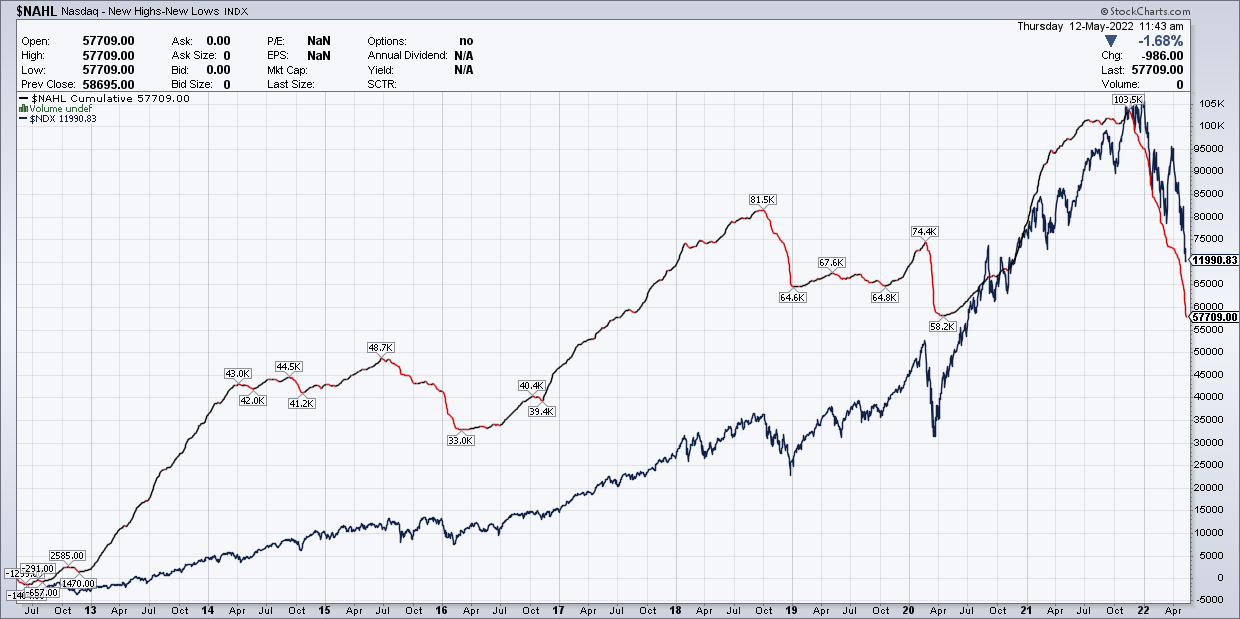
Declining earnings in the broader index level and a declining PE ratio are also reflected on the individual stock level, which appears to be evident in the number of new highs minus the number of new lows in the NASDAQ on a daily basis. The number of new lows has been outpacing the number of new highs for months now, showing no sign of slowing down. A cumulative view of the difference illustrates the very sharp drop since peaking in November.
More importantly, this cumulative number of new highs minus new lows doesn’t seem to have stopped falling yet. In the past, when this indicator stops falling, it happened around the same time that the NASDAQ 100 bottomed.
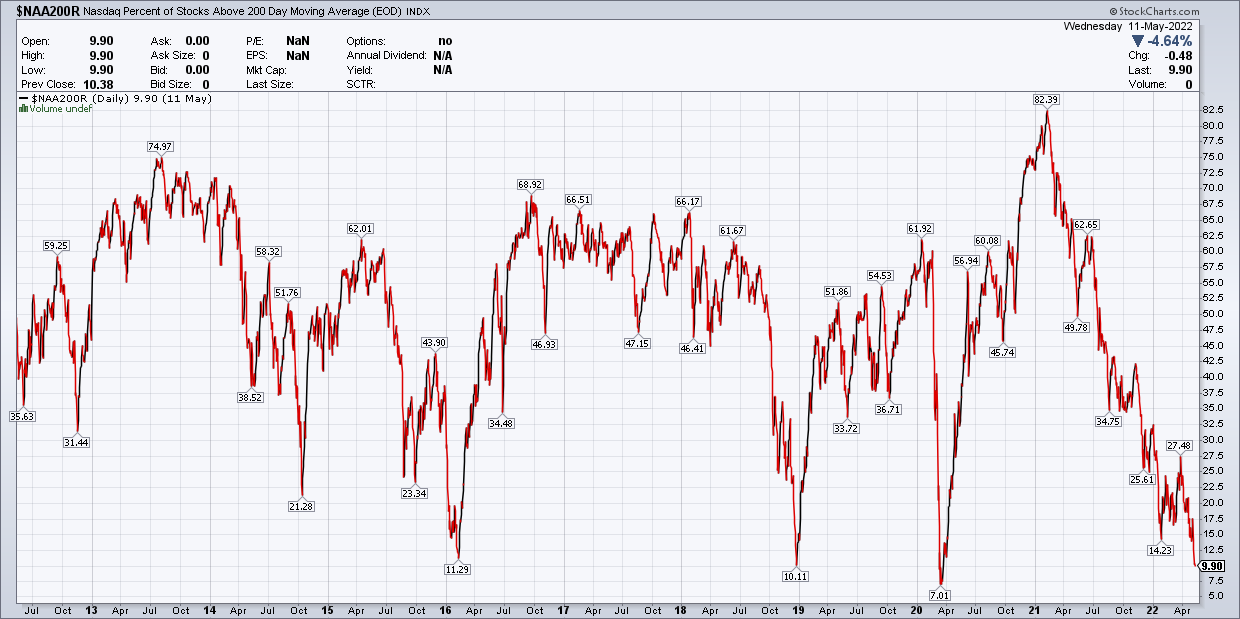
The bright spot is that the percentage of stocks above their 200-day moving average in the NASDAQ has fallen to below 10%. Historically that is a low-level and rare reading. Over the last 20-years, it has only been below 10% a handful of other times, a sign of how depressed many stocks are.
The biggest issue for the NASDAQ and where it goes from here will be how much higher rates rise and whether there is further downside to earnings estimates. This will be dependent on what the Fed plans to do and how high they want rates to go, and the potential impact higher rates will have on the economy.
These are perilous times, and given the path the Fed is taking, it seems unlikely that the NASDAQ’s PE ratio will return to its old highs anytime soon, which may mean the NASDAQ doesn’t see an all-time high again for a long time.

