

DKosig
Political Calculations’ initial estimate of median household income in June 2022 is $77,881, an increase of $616 (or 0.82%) from the initial estimate of $77,265 in May 2022.
The latest update to Political Calculations’ chart tracking Median Household Income in the 21st century shows the nominal (red) and inflation-adjusted (blue) trends for median household income in the United States from January 2000 through June 2022. The inflation-adjusted figures are presented in terms of constant June 2022 U.S. dollars.
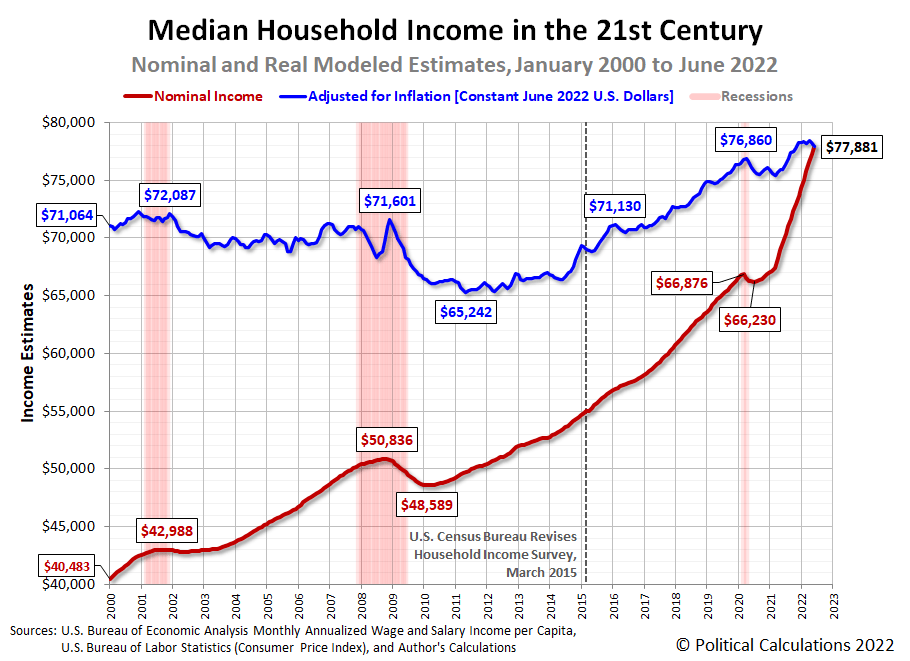
Once again, inflation eroded all of the nominal month-over-month gain for American households in June 2022. For the year-to-date, there has virtually been no real growth in median household income.
Developing Recessionary Conditions
In developing our median household income estimates, we track average earned income per capita as a separate metric. This measure is more sensitive to changing economic conditions, which makes it useful for taking the proverbial temperature of the U.S. economy. Since the Bureau of Economic Analysis has reported the U.S. experienced a second consecutive quarter of negative real economic growth in the second quarter of 2022, we thought we’d present it in this edition of our median household income series.
The following chart shows the average earned wage or salary income per capita in the twenty-first century:
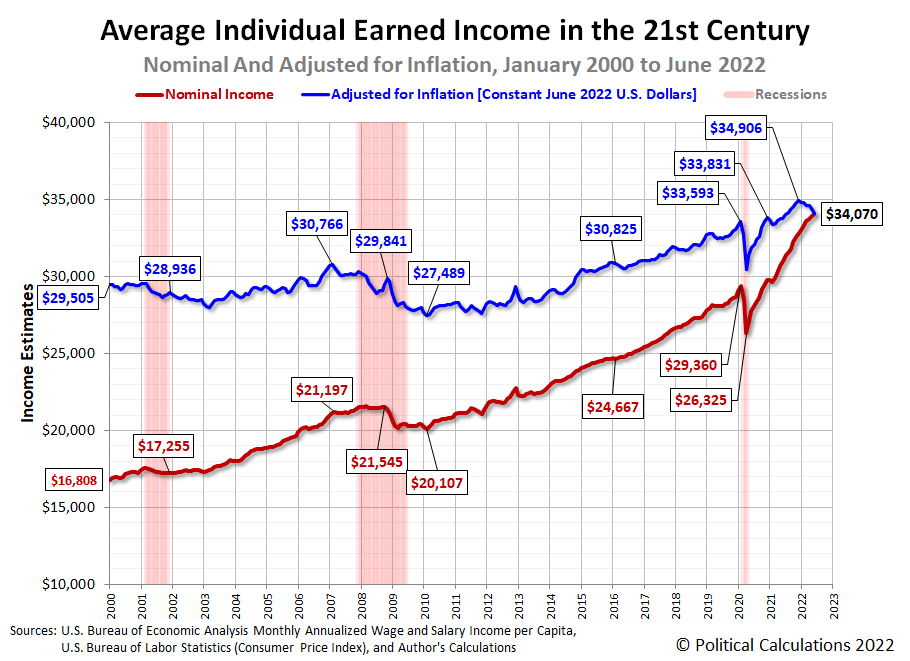
This chart covers three officially declared recessions for the U.S. economy. In each, the nominal (or actual) earned income either stagnated or declined during these periods, while the real (or inflation-adjusted) earned income experienced sustained or deep declines. For this recent history, the official periods of recession more closely coincide with the sustained or deep declines observed in the inflation-adjusted income data.
Now, let’s take a closer look at the most recent data. The third chart shows average individual earned income during the Biden era.
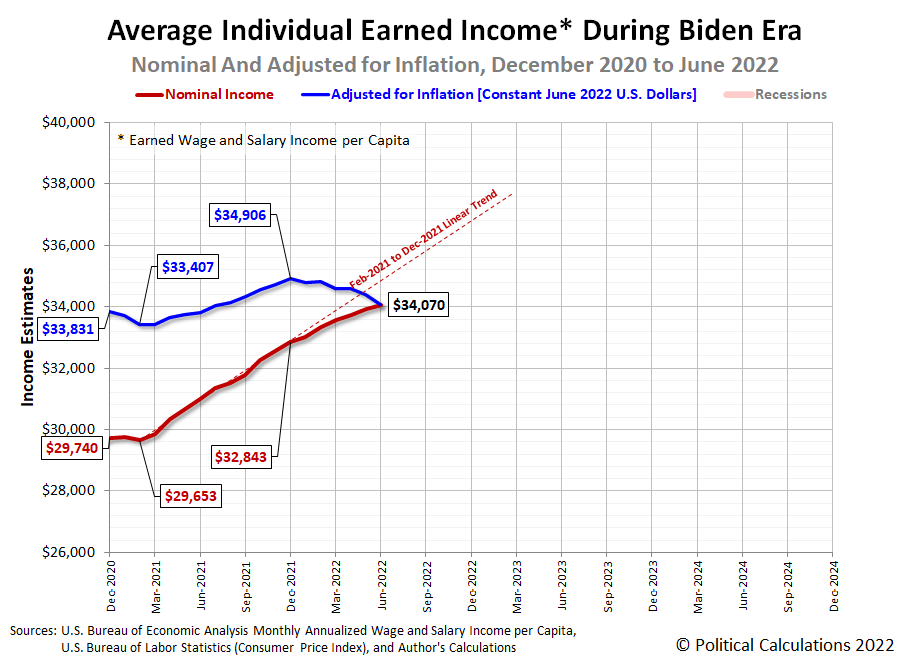
This chart conveys the inflation-adjusted average earned income per capita peaked in December 2021 before a sustained decline that now extends to June 2022, which is consistent with how this measure has behaved during previous recessions. At the same time, the rate at which the nominal average earned income for individual Americans grows has decelerated. This combination is signaling recessionary conditions are building in the U.S. economy.
The way to read this data is that the inflation-adjusted data is voting “Yes, the U.S. economy is in recession”, while the nominal income data is voting “Maybe”. If you want the Magic 8-Ball answer, the average earned income data is saying “Ask again later” while leaning toward “It is certain”.
Analyst’s Notes
The BEA made minor downward adjustments to its aggregate wage and salary data for April (-0.083%) and May 2022 (-0.062%).
Looking forward, the BEA will be making its large, annual revision to its historic aggregate income data at the end of September 2022. This data, when released, may have a major impact on how we assess whether the U.S. economy went into recession in the first half of 2022.
References
U.S. Bureau of Economic Analysis. Table 2.6. Personal Income and Its Disposition, Monthly, Personal Income and Outlays, Not Seasonally Adjusted, Monthly, Middle of Month. Population. [Online Database (via Federal Reserve Economic Data)]. Last Updated: 29 July 2022. Accessed: 29 July 2022.
U.S. Bureau of Economic Analysis. Table 2.6. Personal Income and Its Disposition, Monthly, Personal Income and Outlays, Not Seasonally Adjusted, Monthly, Middle of Month. Compensation of Employees, Received: Wage and Salary Disbursements. [Online Database (via Federal Reserve Economic Data)]. Last Updated: 29 July 2022. Accessed: 29 July 2022.
U.S. Department of Labor Bureau of Labor Statistics. Consumer Price Index, All Urban Consumers – (CPI-U), U.S. City Average, All Items, 1982-84=100. [Online Database (via Federal Reserve Economic Data)]. Last Updated: 13 July 2022. Accessed: 13 July 2022.
Original Post
Editor’s Note: The summary bullets for this article were chosen by Seeking Alpha editors.

