

PeopleImages
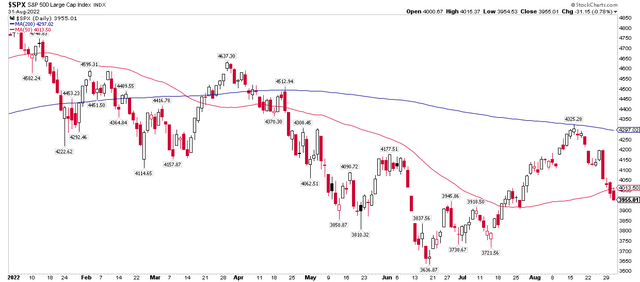
It’s been the summer of volatility. The S&P 500 notched a low back on June 16 then staged a nearly 20% rally to its 200-day moving average two months later. Since then, though, stocks have suffered significant losses as investors grapple with a Federal Reserve pulling no punches on inflation. It’s a no holds barred match against rising consumer prices for the Fed as we head into the notoriously volatile month of September.
S&P 500 Falls Below Its 50-Day Moving Average After A 200-Day Rejection
Stockcharts.com
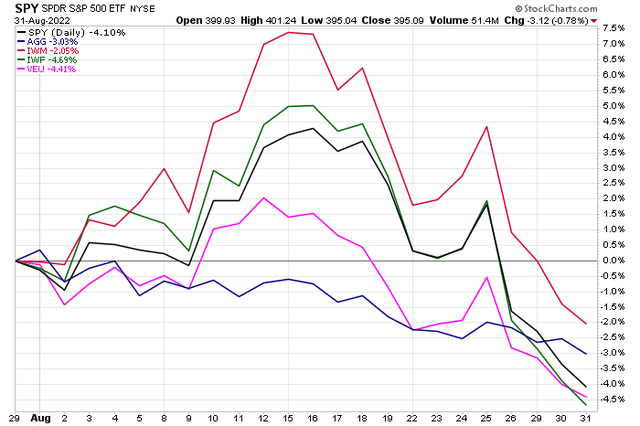
All told, the S&P 500 ETF (SPY) lost 4.1% in August while small caps, as measured by the iShares Russell 2000 ETF (IWM) managed to outperform, dropping 2%. Equities finished Wednesday at the lows of the month.
No safety was found in the fixed-income market as Treasury rates rose big and corporate credit spreads widened. The iShares Aggregate Bond ETF (AGG) featured a decline of 3% (including dividends).
An ongoing energy crisis in Europe, currency woes in Japan, and a still uncertain situation in China all contributed to the Vanguard FTSE All-World Ex-US ETF (VEU) losing ground to domestic equities with a 4.4% August drop.
Big-Cap Tech Leads Stocks Lower Over the Latter Half of August
Stockcharts.com
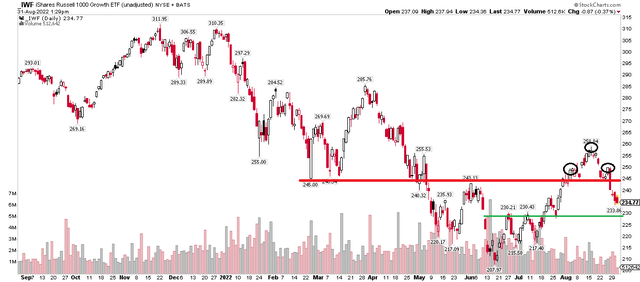
Where was one of the worst broad areas to be positioned over the last two-plus weeks? Large-cap growth names, which performed materially worse than small caps and value stocks. The iShares Russell 1000 Growth ETF (NYSEARCA:IWF) capped off the month with four consecutive daily declines. Tech- and discretionary-dominated companies, often considered high-duration assets, fell out of bed last Friday following Chair Powell’s “painful” message to Wall Street.
Technically, IWF’s daily chart exhibits a bearish head and shoulders pattern with a price objective of $229, which it nearly touched on Wednesday. Investors should watch how large-cap growth trades as we head into the final months of the year. Some of this year’s stalwart stocks are now under attack by the bears.
Large-Cap Growth: Eyeing Support At The Late June/Early July Highs
Stockcharts.com
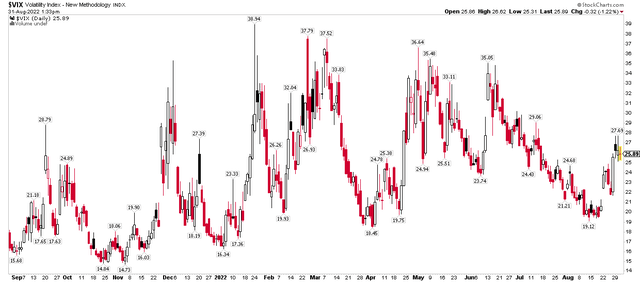
August started with optimism and ended with fear. The Volatility Index managed to dip under 20 for the first time since April during the middle of the month when the S&P 500 briefly climbed above its 200-day moving average. Fear arose quickly, and the VIX jumped to the highest reading in more than a month earlier this week.
S&P 500 Volatility Perks up Heading Into September
Stockcharts.com
The back half of the month had all the hallmarks of the turbulence seen during the first half of 2022. Along with the spike in “vol,” the U.S. Dollar Index jumped to fresh 20-year highs and the Energy sector caught a bid. Shares in oil and gas plays used to generally move inverse to what the greenback was doing, but now that the U.S. has become a major energy producer, care of the shale revolution, higher energy prices are not all bad. In fact, according to a forecast put out by Goldman Sachs Investment Research, the Energy sector is expected to account for the S&P 500’s entire 8% earnings growth rate in 2022.
2022 S&P 500 Earnings Growth: All Energy
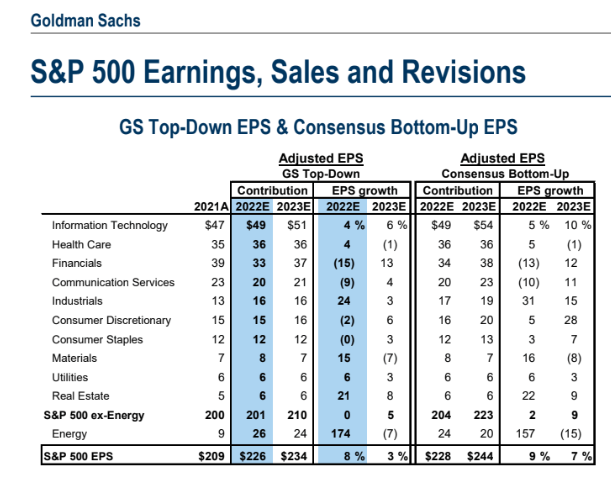
Goldman Sachs Investment Research
There’s great news for American consumers on the energy front – wholesale gasoline prices dropped to their lowest level since January as RBOB rolls to the winter-blend October contract.
Gasoline Futures Suggest Much Lower Pump Prices Ahead
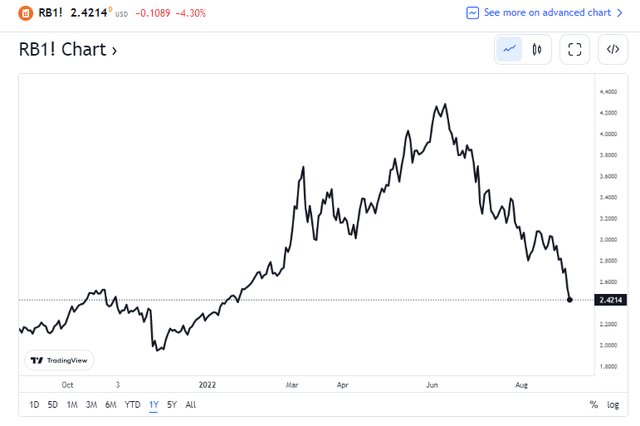
TradingView
There’s no way to put a positive spin on the energy situation across the pond, though. On my list of “charts of the year” is one posted Wednesday by Holger Zschaepitz. German year-ahead power futures went ballistic earlier this week but then collapsed in what consumers hope will prove to be a bearish blow-off top. Along with how U.S. large-cap growth stocks trade, European natural gas and power market prices will certainly drive risk-on/risk-off behavior in September.
German Power Prices Go Parabolic, Then Drop
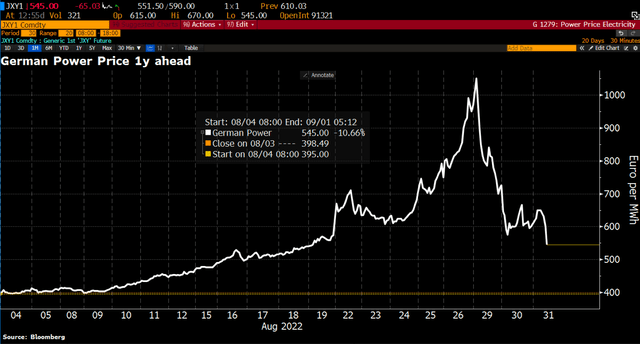
Bloomberg
Looking ahead, we’ll know more about the state of the economy following Thursday’s key ISM Manufacturing number and Friday’s all-important August employment report (including pivotal wage data). The next CPI print comes on Sept. 13.
The Bottom Line
August once again reminded us how quickly the narrative can flip. The first half of the month was a great time for the bulls as it appeared corporate earnings and economic data were turning the Fed’s way. Robust employment growth amid cooling consumer prices looked to be a goldilocks scenario, increasing the chance for a soft landing. Unfortunately, a hawkish Jackson Hole speech by Jay Powell renewed fears that interest rates might have to be “higher for longer” to whip inflation.
