

Gold talking points:
- Q4 is beginning with a ray of hope as bond yields are pulling back and that’s helping to reduce pressure in a variety of areas, such as both stocks and gold.
- As looked at last week, the longer-term outlook is bearish for gold given the picture around rates and Fed policy. Shorter-term, however, there may be scope for a deeper pullback in the bearish move as price has quickly returned to a key resistance zone after setting higher-low support.
- The analysis contained in article relies on price action and chart formations. To learn more about price action or chart patterns, check out our DailyFX Education section.
Recommended by James Stanley
Get Your Free Gold Forecast
We’ve just finished a brutal Q3 for risk assets and already in Q4 a ray of hope has shown as US Treasury Yields have started the quarter with a pullback. That’s helped to remove pressure from a number of markets, key of which is equities and commodities. The bigger question, of course, is whether this is a reprieve from a larger trend or the start of a new one, and I think much of the world is probably settled on the former rather than the latter. So, any strength that we see in risk assets on the basis of falling yields seems a temporary theme in the bigger picture. If pullbacks do remain in-play, they could quickly turn-around again when we run into the next major driver that reminds the world that the Fed isn’t finished yet with rate hikes.
Last week saw the 10 year note reach a fresh 11-year high for yield at 4%. This happened on Thursday, the same time that gold bottomed-out, setting a fresh two-year-low. And as rates continue to rise, the backdrop for gold remains bearish. Higher rates mean more opportunity cost for being invested in non-yielding instruments and while this may not impact every gold investor – it impacts some – and that leads to a change in the supply/demand equilibrium of gold which leads to the build of longer-term trends, such as we’ve seen throughout this year as the Fed has ramped up their hawkishness in the effort of tackling inflation.
It’s perhaps no coincidence that in the same month that the Fed ramps up QT while continuing with rate hikes, gold prices broke the bottom of a double bottom formation as looked at last week. Longer-term, this has bearish connotations as the neckline of the formation is at an area of prior resistance-turned-support. The same area of resistance today was in-play ahead of the pandemic, helping to set the highs for gold and quickly came back into play in early-2021 as support, which held through multiple inflections in the eighteen months after. Until two weeks ago, that is.
Gold Weekly Price Chart
Chart prepared by James Stanley; Gold on Tradingview
Gold Longer-Term
Taking a step back on the chart highlights the attractiveness of the longer-term theme with focus on the recent breach of neckline support for the double top formation. This also highlights some context for continued bearish scenarios, putting focus on the 1567 level and perhaps more to the point, an area around 1454 which is confluent with a batch of swing lows from November 2019 to March 2020 that aligns with the 61.8% Fibonacci retracement of the 2016-2020 major move.
Gold Monthly Chart
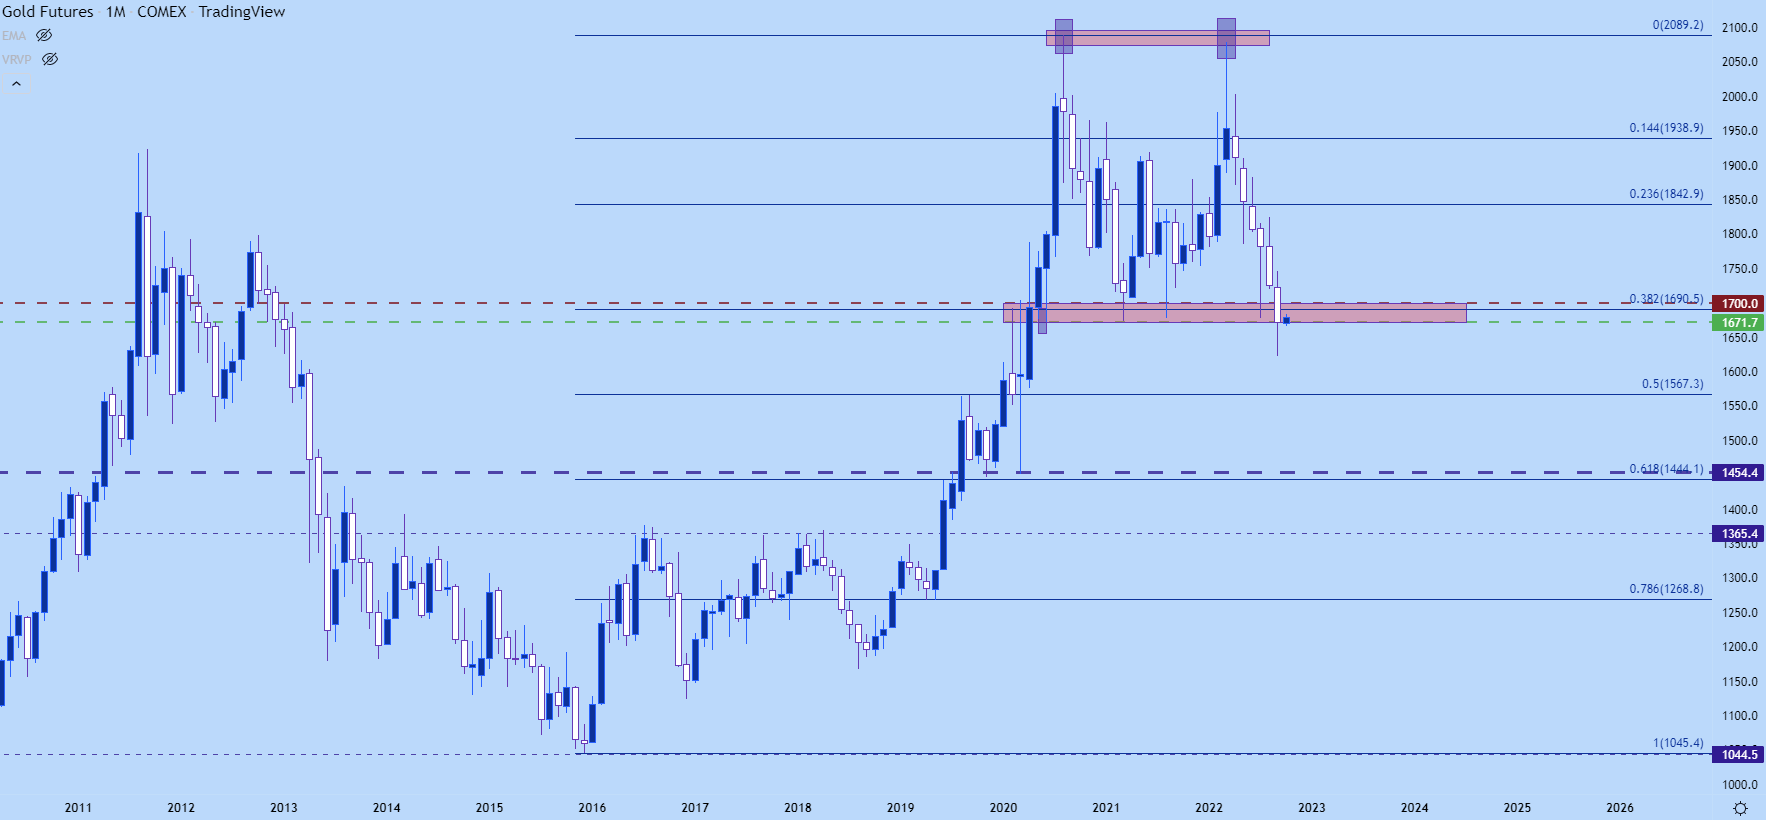
Chart prepared by James Stanley; Gold on Tradingview
Gold Shorter-Term
I highlighted this in last week’s piece but, generally speaking, traders want to look to sell resistance and buy support. Of course, there are breakout strategies that look to do the opposite – selling at prints of fresh lows or buying on pushes up to fresh highs. But, in gold of late, that breakout style has seemed especially perilous to my eyes during this recent downside run. So, patience is a priority for gold bears as the pullbacks can be especially brutal to sit through, such as we saw in the first two weeks of September when gold ran up to $1746 after an earlier-month support test at the 1700 psychological level.
And that’s a price that may be back into the picture before long, as there’s a short-term retracement working in gold at the moment and there may be scope for more room to run. Last week saw gold find higher-low support at prior resistance, plotted at around 1650. This took place shortly after a test of resistance at a higher-high, and bulls have continued to push the sequence so far into this week.
There’s a short-term falling wedge in-play to start the week and this has leanings of a bull flag as well. This puts the focus on a push up to resistance levels around 1690 or perhaps even 1700. A move up to either of those resistance levels could potentially re-open the door for longer-term bears but, again, traders are going to want to read price action to get a feel that sellers may be using that bounce to position-in to longer-term trends.
Gold Two-Hour Price Chart
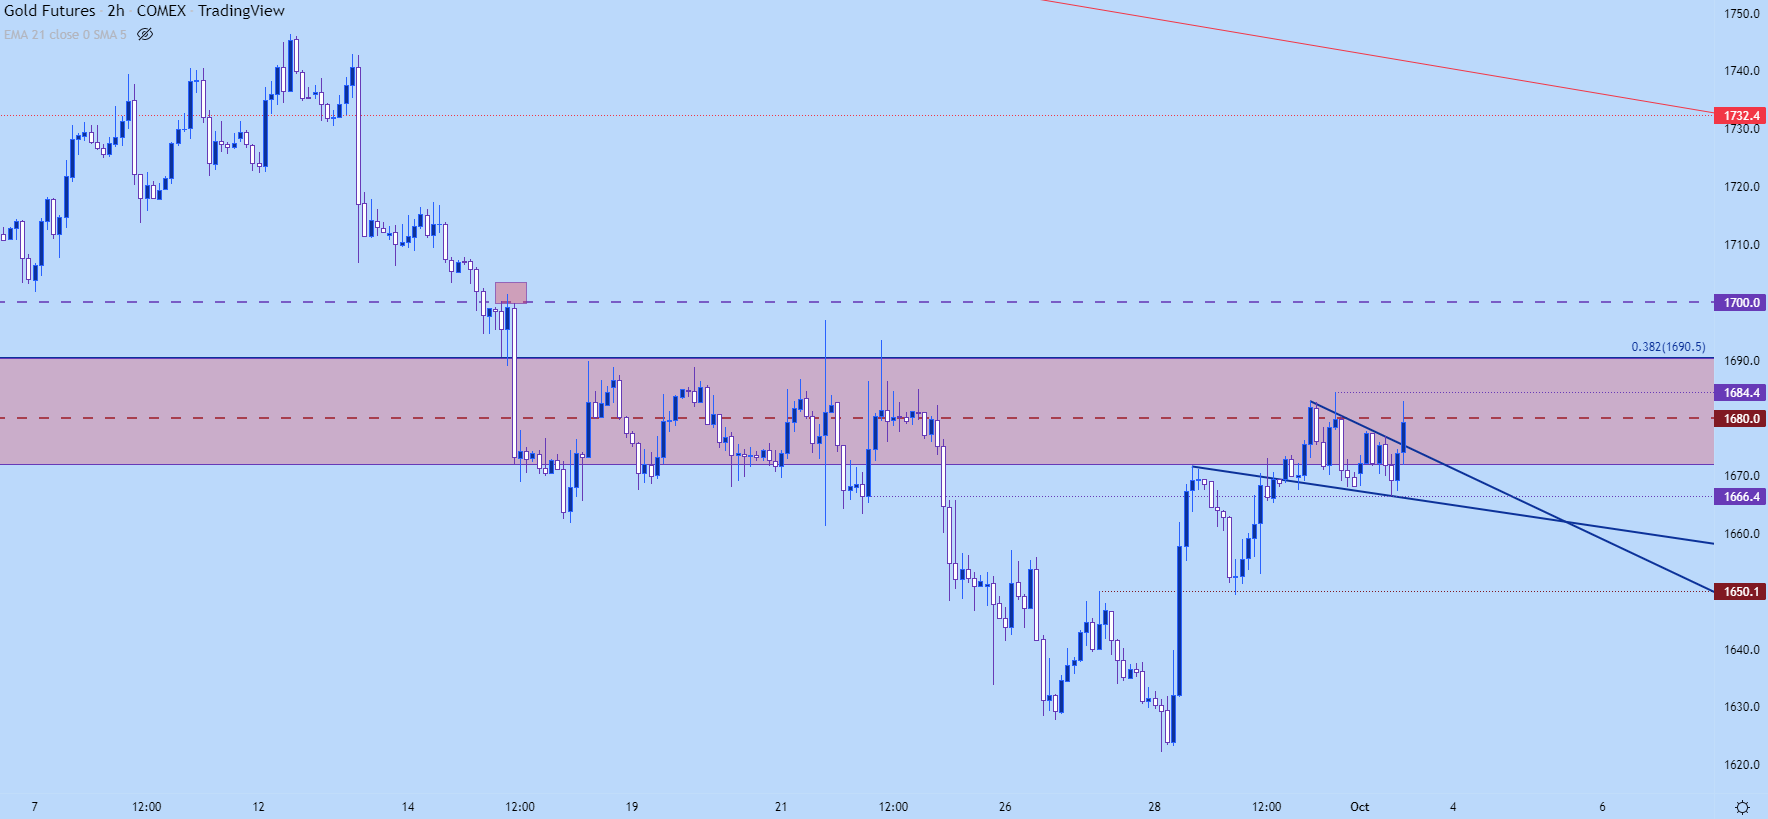
Chart prepared by James Stanley; Gold on Tradingview
— Written by James Stanley, Senior Strategist, DailyFX.com & Head of DailyFX Education
Contact and follow James on Twitter: @JStanleyFX

