

Gold Price Talking Points
The price of gold bounces back from a fresh monthly low ($1643) as it attempts to retrace the decline following the update to the US Consumer Price Index (CPI), but bullion may struggle to retain the rebound from the yearly low ($1615) as it fails to defend the opening range for October.
Gold Price Vulnerable After Failing to Defend Monthly Opening Range
The price of gold appears to be mirroring the price action from August as it tracks the negative slope in the 50-Day SMA ($1711), and the precious metal may continue to weaken over the coming days as Treasury yields climb to fresh yearly highs.
It seems as though expectations for higher US interest rates will continue to drag on the price of gold as the stickiness in consumer prices encourages the Federal Reserve to retain its existing approach in combating inflation, and bullion may face additional headwinds ahead of the next Fed interest rate decision on November 2 as it puts pressure on the Federal Open Market Committee (FOMC) to pursue a highly restrictive policy.
Source: CME
Looking ahead, the CME FedWatch Tool now shows a greater than 90% probability for another 75bp rate hike amid the ongoing price growth in the US, and the FOMC may strike a hawkish forward guidance throughout the remainder of the year as the central bank struggles to curb inflation.
With that said, the price of gold may continue to track the negative slope in the 50-Day SMA ($1711) as it struggles to hold above the moving average, and bullion may give back the rebound from the yearly low ($1615) as it fails to defend the opening range for October.
Gold Price Daily Chart
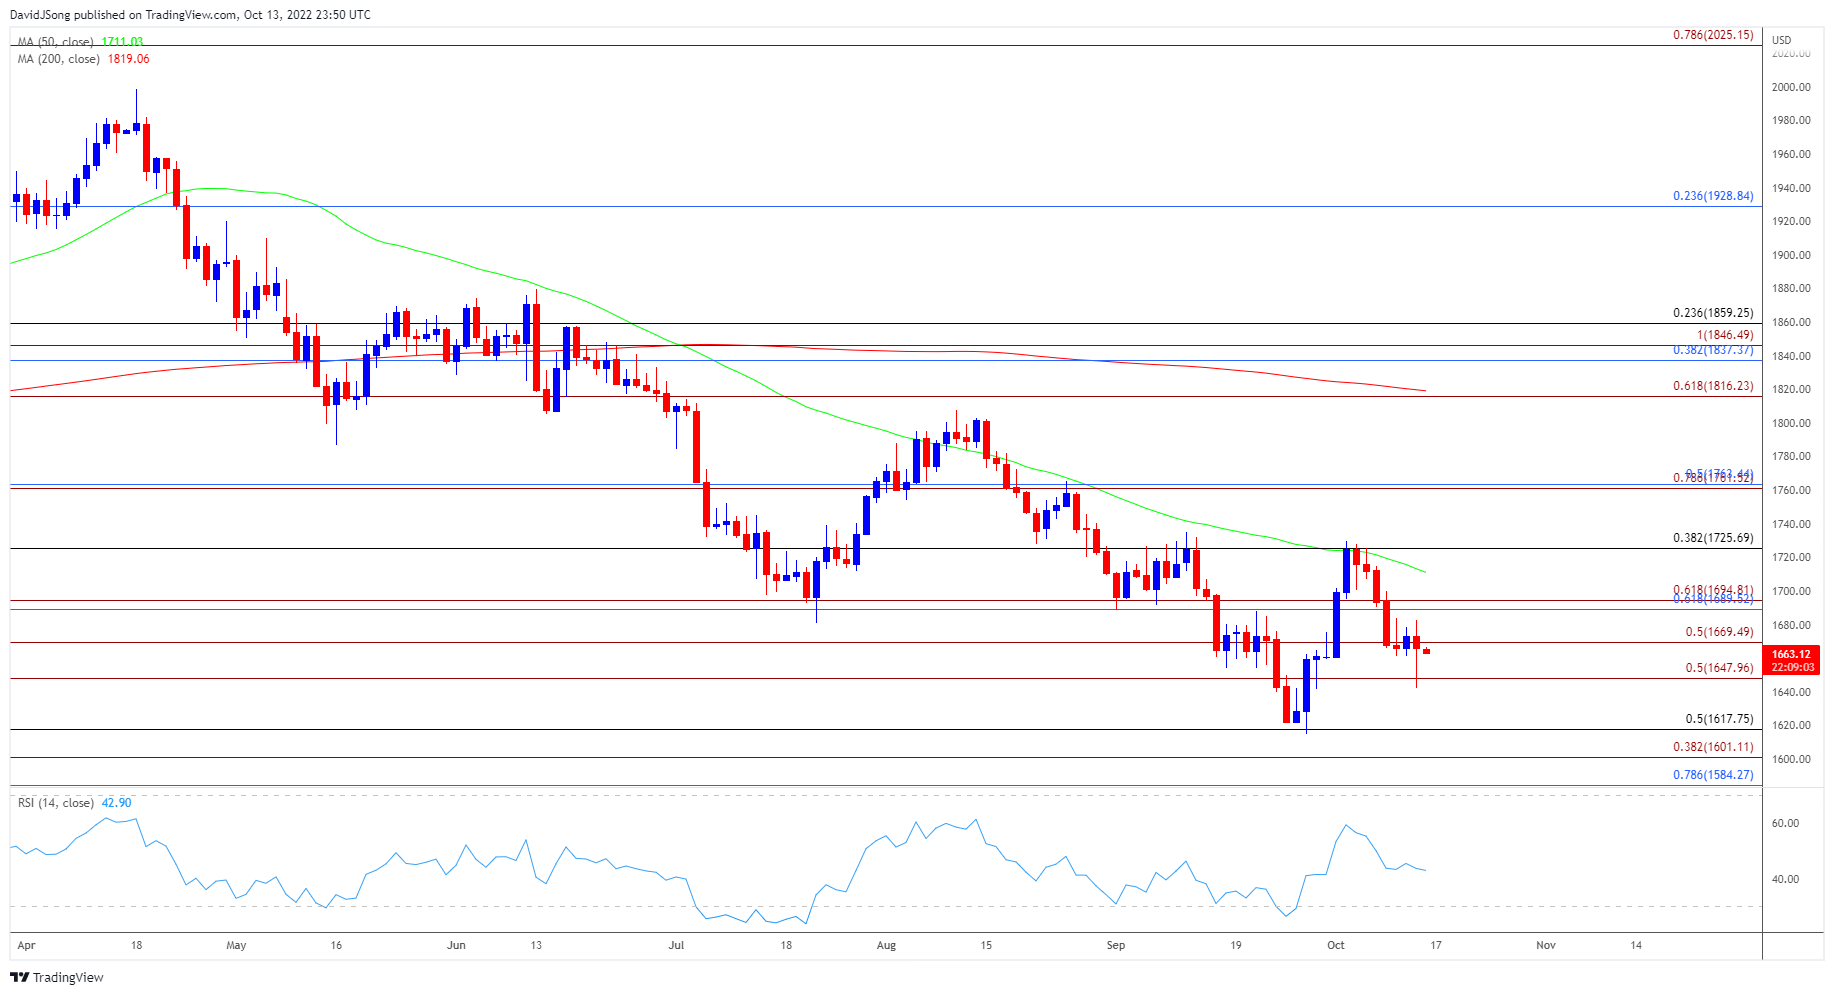
Source: Trading View
- The price of gold trades to a fresh monthly low ($1643) after struggling to hold above the 50-Day SMA ($1713), and the precious metal may continue to track the negative slope in the moving average like the price action seen in August.
- Need a close below the $1648 (50% expansion) region to bring the Fibonacci overlap around $1601 (38.2% expansion) to $1618 (50% retracement) on the radar, with a break below $1584 (78.6% retracement) opening up the April 2020 low ($1568).
- However, lack of momentum to close below the $1648 (50% expansion) region may generate range-bound conditions in the price of gold, with a move above the $1690 (61.8% retracement) to $1695 (61.8% expansion) area raising the scope for another test of the moving average.
Trading Strategies and Risk Management
Becoming a Better Trader
Recommended by David Song
— Written by David Song, Currency Strategist
Follow me on Twitter at @DavidJSong
