

Every day seems filled with some new comment or data point that suggests the global market or the Fed will aggressively attempt to burst the inflation bubble. Global central banks continue to warn that COVID, and other issues, persist. Traders seek some clarity and understanding of what’s going to happen next.
Will U.S. Stock Market Continue To Rally Higher?
Allow us to help you understand what is happening behind all these data points and news posts. We can understand key market components better by using specialized modelling systems that aim to distill market events into relatable trigger events within our strategies. This, in turn, helps us to better understand what may come next for the US markets.
We’ll focus on some of our custom indexes to better illustrate current market trends and conditions. These are examples of our Custom Smart Cash Index (a more global market custom index), our Commodity Price Index,and our Custom US Index (a focused US Custom Index).
Comparing Global Market Index Versus The U.S. Market Index
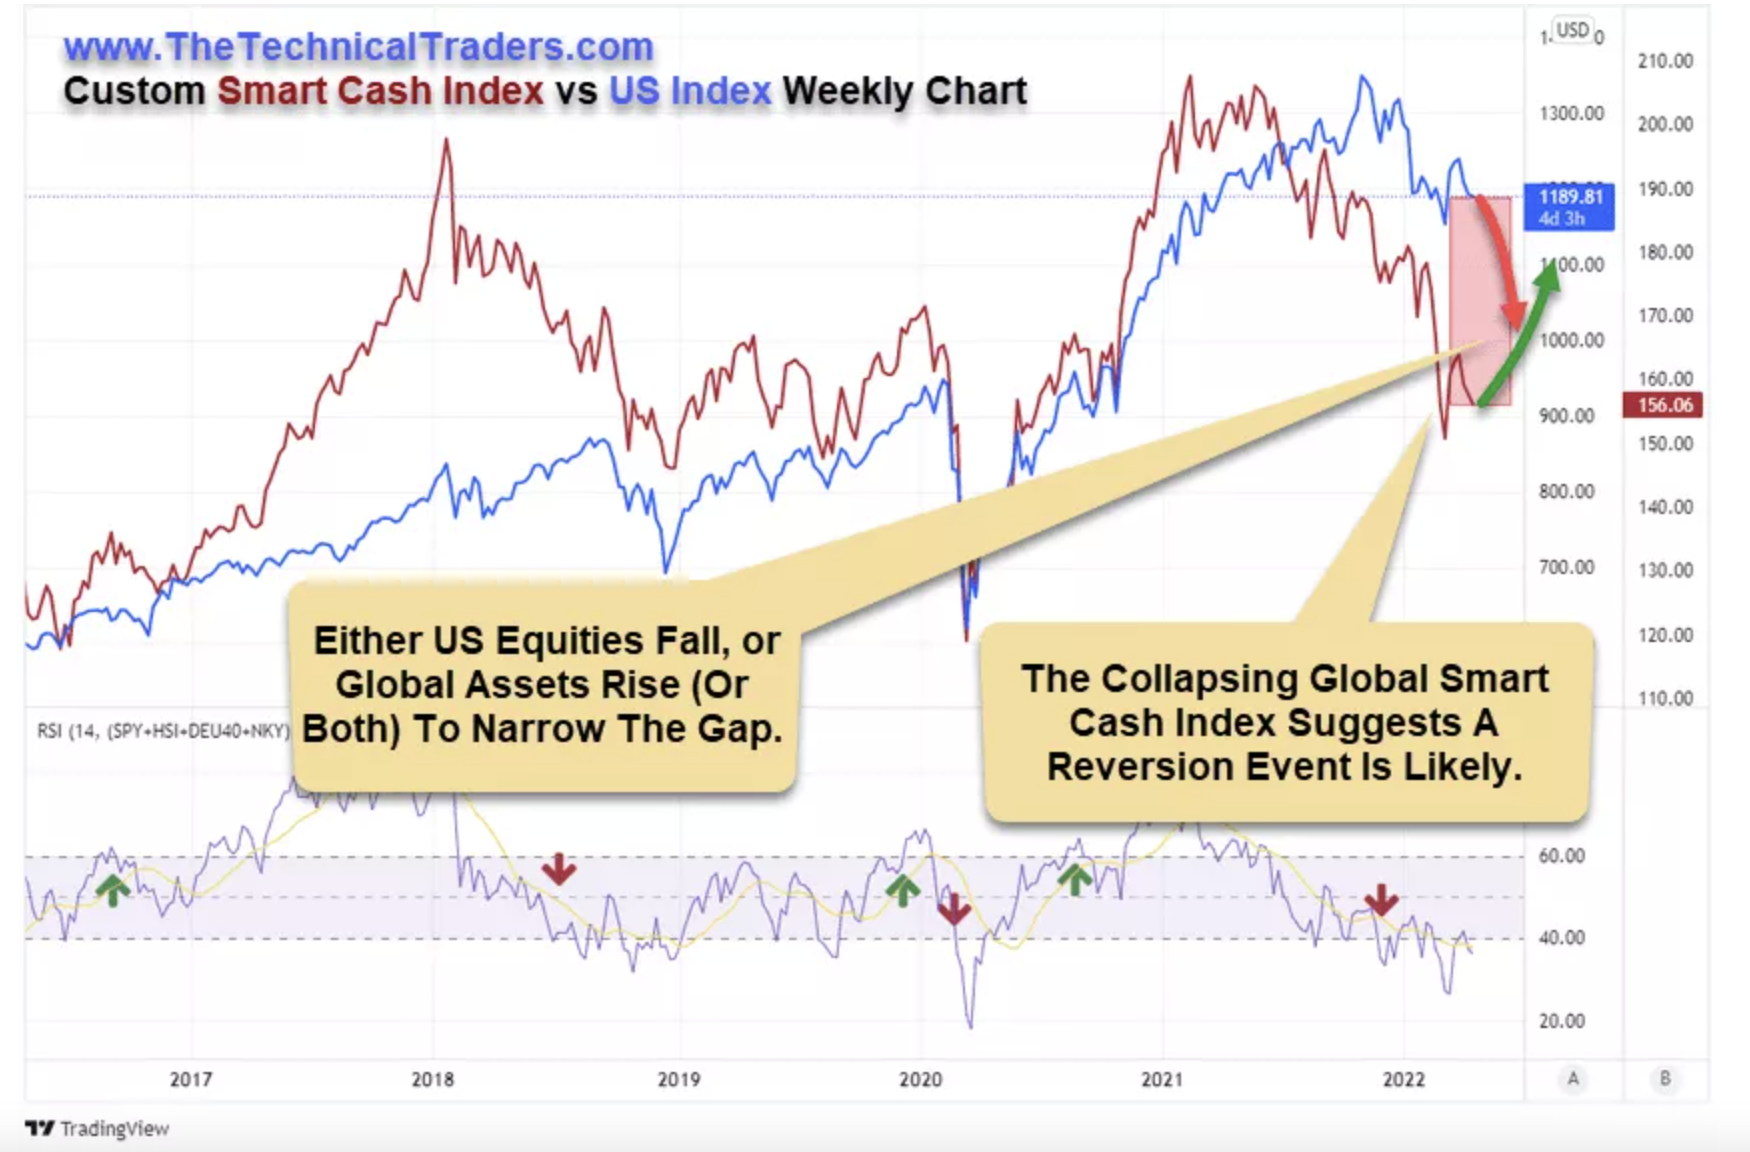
Looking at this custom Weekly Smart Cash Index vs. the US Index, it is evident that the Smart Cash Index (in RED) has fallen very sharply over the past 14+ months. We can interpret this downward trend as a sharp shift in inflationary, deleveraging, and economic trends in Asia and much of Europe. We find this shift interesting because it took place after a substantial rally in both U.S. and global market assets from November 2020 to early February 2021.
After the February/March 2020 COVID-19 event, the global markets entered a period of extensive economic recovery. The rebound in global stock market price levels prompted a strong wave of consumer engagement, rising asset prices, and robust demand for commodities, raw materials, homes, autos and other core assets. As a result, consumers were flush with cash, and inflation levels were still timid (at best) – resulting in a +56% rally in the NASDAQ from October 2020 to the recent highs.
In February/March 2021, something shifted rather dramatically to push the global markets into this new downward trend. What happened?
Custom Commodity Price Index Chart Rallied 478% Above Normal Levels In Early 2021
In our opinion, the extended demands relating to the superheated reflation of the post-COVID economy set off an explosive inflation trend. The following chart shows our Custom Commodity Price Index Weekly chart – highlighting the date range from February 2020 to mid-May 2021. You can see from this chart the normal upper price range has historically been near 4.5 to 4.7 for moderately strong commodity and raw material demand.
In late 2020, our Custom Commodity Index chart pushed upward to a level near 8.0 in August 2020. Then, just after the US Presidential Elections, these levels rose even higher – reaching a peak level of 22.50 near early May 2021. That is a massive 478% higher than historical normal inflation levels.
What happened to the Smart Cash Index was multi-faceted. Inflation, deleveraging of a speculative bubble, and consumers pulling away from big-ticket purchases likely prompted a revaluation of assets throughout the globe while these inflation trends continued to elevate.

Debt/Credit Concerns Could Be Driving Investor Sentiment Now – Actively Seeking U.S. Dollar Safety
As we’ve seen, Chinese real estate developers struggle with excessive debts and price levels contracts as consumers pull away from risks throughout the globe. The question becomes, globally are we only starting this new deleveraging event process.
Many months ago, we published an article suggesting a new depreciation cycle phase had started in December 2019 (just before the COVID-19 virus hit). You can read that article here: US DOLLAR BREAKS BELOW 90 – CONTINUE TO CONFIRM DEPRECIATION CYCLE PHASE. We want to highlight the transition that is taking place throughout the globe related to this depreciation cycle Phase. Looking at past research can help you better understand the broad-market trends.
Depreciation Cycle Phase Will Prompt Asset Revaluation Process
First, as global markets continue to struggle to find support, global assets will naturally migrate to the safest and strongest global assets (which appear to be the U.S. dollar and U.S. stocks at this point).
Eventually, assets will shift into “bottom-fishing,” while global assets appear to have reached an intermediate base level. This happens as shifting valuation levels drive investors to “fish” for opportunities – trying to pick bottoms in downward trending assets. Stay cautious of this type of activity.
Lastly, continuous deleveraging pressure may prompt even the most vital assets to fall, closing the gap between the U.S. Custom Index and the Smart Cash Index.
I will highlight the potential that a rally in the Smart Cash Index while the U.S. Custom Index trends lower (where both asset bases converge) would also attempt to satisfy a revaluation process.
The Custom Smart Cash Index Weekly Chart shows current price levels are just below the 2019 highs. What this translates to is the global market level has deflated more than -26% from the early 2021 peak level. Much of this is related to what is happening in China/Asia, but it also reflects a broader deleveraging event that continues to unfold.

Concluding Thoughts
The major global economies (U.S., UK, Japan) will not likely stay immune from these downward trends. Eventually, the pressures related to deleveraging and inflation will push asset prices into a revaluation process. What that looks like is anyone’s guess at the moment.
The U.S. markets will attempt to hold near recent lows as long as the U.S. dollar and foreign investors continue to see the safety and security of the U.S. economy. If the U.S. economy falters, capital will quickly move into broader safe-haven or opportunistic global assets (cryptos, metals, bonds or undervalued global markets).
