

EURUSD Price Analysis – September 26
When the bears’ momentum break down the support level of $0.95, the price may reach support levels of $0.94 and $0.93. In case the buyers push up the price above the resistance level of $0.97, the price may increase to test the resistance level of $0.98 which may extend to $0.99 level.
EUR/USD Market
Key Levels:
Resistance levels: $0.97, $0.98, $0.99
Support levels: $0.95, $0.94, $0.93
EURUSD Long-term Trend: Bearish
EURUSD is bearish on the long term outlook. The currency pair was bullish last week. Buyers pushed the price to the high of $1.01 resistance level. The price commenced a ranging movement for many days within $1.00 and $0.98 levels. Price tested the resistance level of $1.01 on September 13 and pulled back to retest the support level of $0.99. On September 21, Sellers dominates the market with their high momentum. The support level of $0.98 and $0.97 was penetrated downside and the support level of $0.95 is tested.
The bears’ pressure has penetrated the two EMA downside. EURUSD is trading below the 9 periods EMA and the 21 periods EMA. When the bears’ momentum break down the support level of $0.95, the price may reach support levels of $0.94 and $0.93. In case the buyers push up the price above the resistance level of $0.97, the price may increase to test the resistance level of $0.98 which may extend to $0.99 level. The Relative Strength Index period 14 is at 25 levels with the signal line pointing down to indicate a sell signal.
EURUSD medium-term Trend: Bearish
EURUSD is bearish in the medium-term outlook. The buyers could not break up the resistance level of $1.01 which was tested last week with much pressure from the buyers. The buyers’ pressure became weak and could not break up the just mentioned resistance level. Bearish engulfing candle formed and the price broke down the dynamic support levels. Sellers’ pressure increases and the price reduces to $0.95 level at the moment.
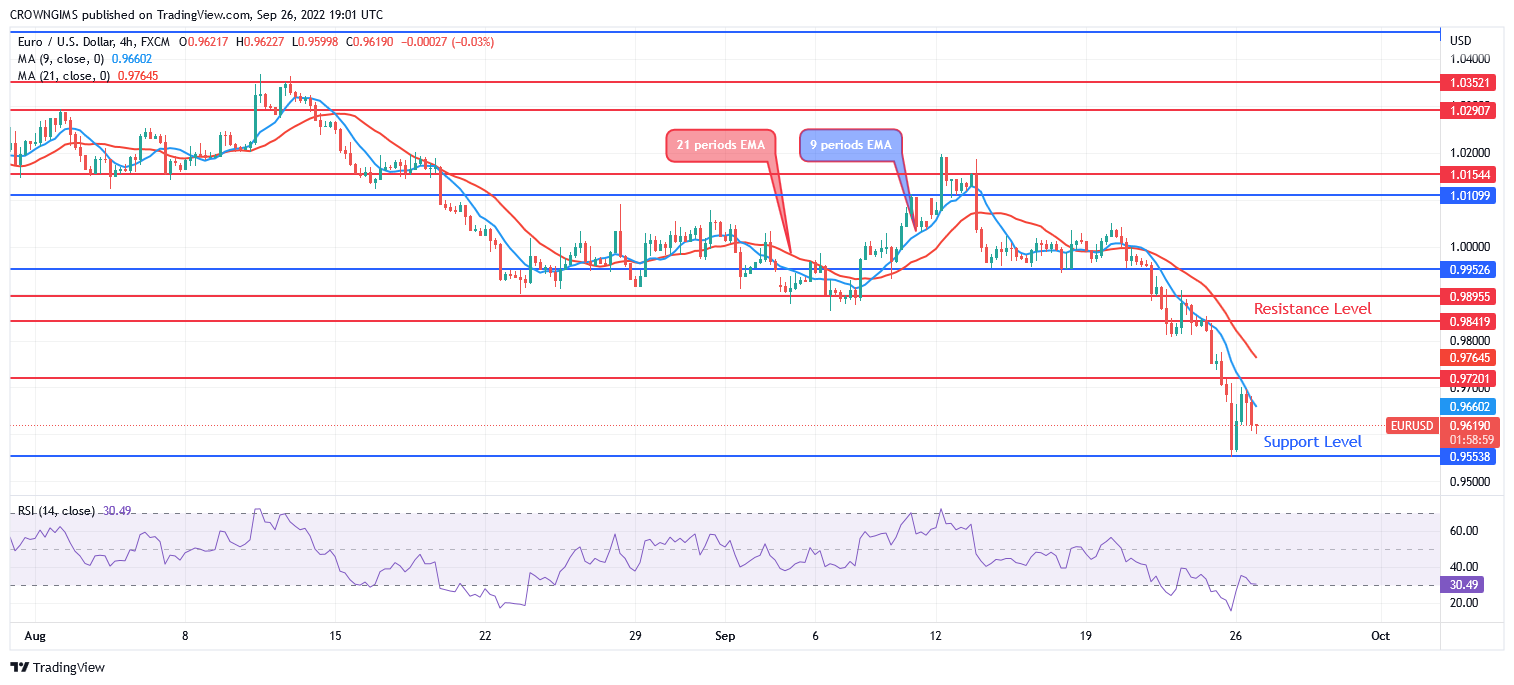
The price is trading below the 9 periods EMA and 21 periods EMA, the two EMAs are separated from each other as a sign of bearish market. The Relative Strength Index period 14 is pointing down at 30 levels indicating sell signal.

