

Ethereum Bullish Breakout Pauses at Technical Resistance
- Ethereum (ETH/USD) bullish breakout stalls at trendline resistance
- ETH/USD faces a challenging task of clearing the $1600 psychological level
- Cryptocurrency still poised to end the week higher despite a retracement from yesterday’s highs
Recommended by Tammy Da Costa
Get Your Free Bitcoin Forecast
Ethereum (ETH/USD) is looking to end the week with double digit gains after a bullish breakout drove prices out of their recent range.
After five weeks of trading with lackluster motion, an influx of buyers and a rejection of the 1200 handle earlier this month allowed ETH/USD to find stability back above 1266. With a series of low bodied candles forming between this level and 1331, both bulls and bears remained restricted while another zone of resistance helped cap the wicks of the candles since late September at 1383.
Ethereum (ETH/USD) Weekly Chart
Chart prepared by Tammy Da Costa using TradingView
As prices continued to consolidate, a fresh bout of bullish momentum this week drove price action through prior resistance turned support suggesting that bulls aren’t ready to surrender just yet.
With the descending trendline from the December 2021 move firming at around 1580, a break of the 1600 psychological level is still necessary before a resumption of the upside move.
Recommended by Tammy Da Costa
The Fundamentals of Breakout Trading
Meanwhile, the daily chart provides a clearer visual of the short-term levels that may still come into play. Above 1600, the 1650 handle could pose an additional threat while a move higher and a hold above 1728 opens the door for a retest of 1800.
Ethereum Daily Chart
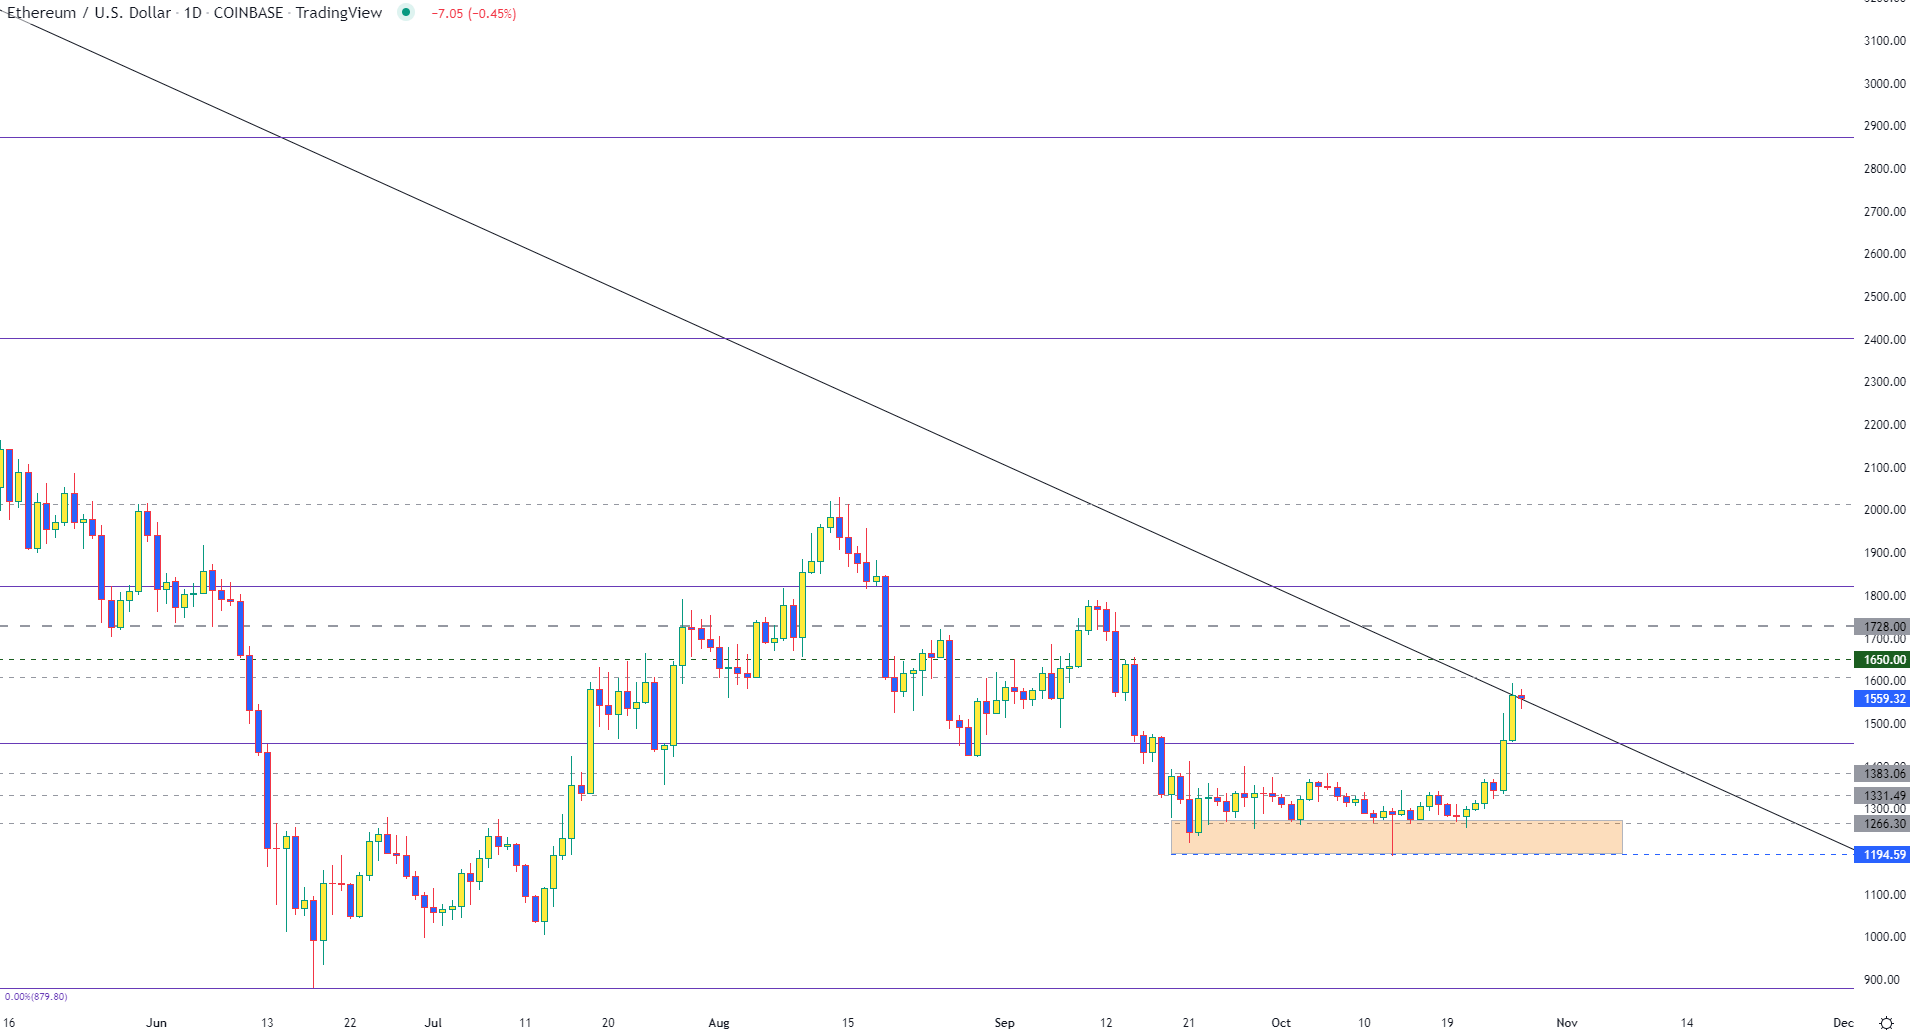
Chart prepared by Tammy Da Costa using TradingView
On the contrary, failure to gain momentum above resistance and a move lower could see bears stepping in and driving prices back towards 1454 (the 14.4% Fibonacci of the November – June move) in an effort to drive ETH/USD back towards the prior range between 1383 and 1220.
— Written by Tammy Da Costa, Analyst for DailyFX.com
Contact and follow Tammy on Twitter: @Tams707
