

The Ethereum price prediction is down at 3.18% at the time of writing as the coin goes below the opening price of $2856.
ETH/USD Market
Key Levels:
Resistance levels: $3200, $3400, $3600
Support levels: $2400, $2200, $2000

ETH/USD breaks below $2800 after an unsuccessful attempt to settle above the 9-day and 21-day moving averages. At the time of writing, the Ethereum (ETH) is changing hands at $2765, down 3.18% after touching the daily high of $2861. For the past few days, bears have so far been keeping the market price below the moving averages; hoping to touch the nearest support at $2500.
Ethereum Price Prediction: Can Ethereum Price Spike Above $3000?
The Ethereum price is currently heading to the south, but according to the daily chart, a break above the resistance level of $2900 could most likely give the Ethereum price a boost towards the important resistance at $3200, $3400, and $3600 levels. On the other hand, the technical indicator Relative Strength index (14) has a bearish feel as the signal line moves to cross below the 40-level. However, the first support could be located below the lower boundary of the channel.
Meanwhile, if the coin dives below the channel, the Ethereum price could visit more downwards. Nevertheless, the market price may keep ranging if the technical indicator RSI (14) signal line continues to move in the same direction. On the other hand, the critical support levels could be found at $2400, $2200, and $2000.

When compared with Bitcoin, the bears are making effort to step back into the market while the coin is showing some negative signs that could make lower lows if the price moves below the 9-day and 21-day moving averages. On the downside, the nearest level of support lies at 6600 SAT and below.
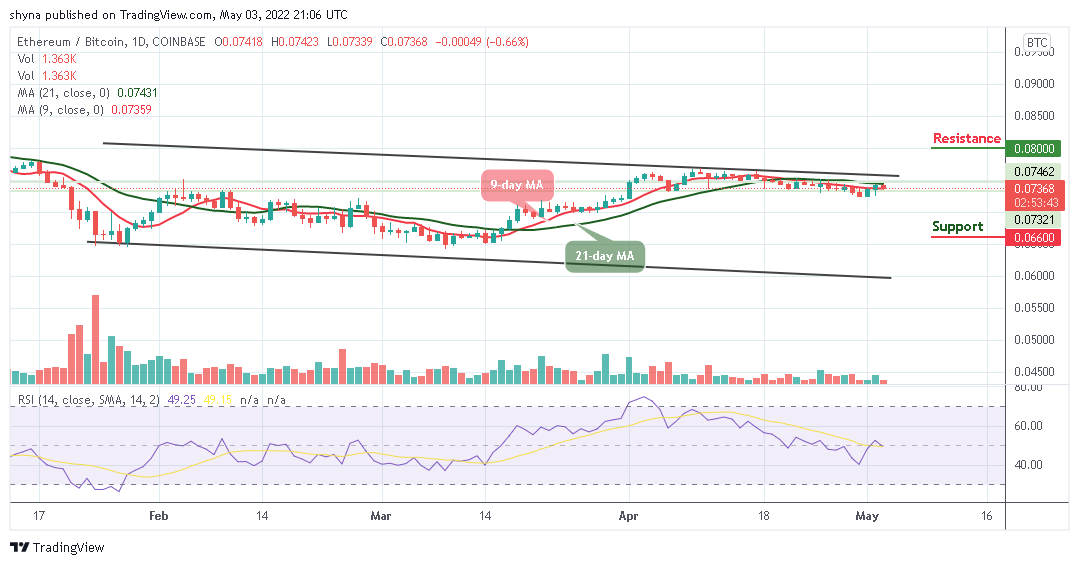
Therefore, looking from the upside, the nearest resistance level is found above the upper boundary of the channel, above this, further resistance lies at 8000 SAT and above. The technical indicator Relative Strength Index (14) is likely to cross below the 40-level which indicates that more bearish signals may come to focus.
Looking to buy or trade Ethereum (ETH) now? Invest at eToro!
68% of retail investor accounts lose money when trading CFDs with this provider
