

Copper Price Outlook:
- Copper prices have continued their rebound from their May lows as China’s zero-COVID strategy appears to be winding down.
- Copper supplies exceeded demand in 1Q’22, according to the recent update from the International Copper Study Group.
- The surplus in copper stocks may fade if China continues to move away from zero-COVID.
China Matters Most
Copper prices had a rough first four and a half months of 2022. Copper demand stopped outstripping supply for much of the year, as the May bulletin from the International Copper Study Group (ICSG) showed. According to the report, the copper market had a surplus of 77,000 tons through 1Q’22, even as “government imposed restrictions related to COVID-19 and sustained rates of infection due to the Omicron variant continued to constrain mine output in a number of countries at the beginning of 2022.”
But the past three weeks have brought modestly better forth better fortunes for copper prices. Some of the aforementioned government restrictions – mainly China’s zero-COVID strategy – appear to be waning. An expected uptick in demand from the world’s largest consumer of copper has been providing speculative tailwind for copper prices since mid-May.
That’s not to suggest that all is well for copper prices moving forward. The near-term technical outlook may have improved, but as far as Dr. Copper goes, a deteriorating global macro outlook for the world economy suggests that sideways trading – which has been the predominant trend since March 2021 – will likely continue over the coming months.
COPPER PRICE TECHNICAL ANALYSIS: DAILY CHART (March 2020 to June 2022) (CHART 1)
Copper prices have reclaimed the 23.6% Fibonacci retracement of the 2020 low/2021 high range at 4.2000, and in doing so, have stabilized above their daily 21-EMA (one-month moving average). Momentum indicators continue to turn more bullish. Copper prices are above their daily 5-, 8-, 13-, and 21-EMA envelope, which is not yet in bullish sequential order. Daily MACD is trending higher but remains below its signal line, while daily Slow Stochastics are just arriving in overbought territory. A move towards the May high at 4.440 appears possible in the near-term.
COPPER PRICE TECHNICAL ANALYSIS: WEEKLY CHART (November 2008 to June 2022) (CHART 2)
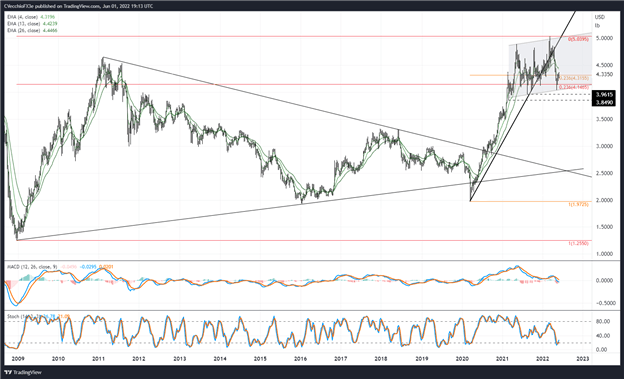
With the multi-month bull flag is still technically intact, the prevailing fundamental environment suggests it will remain intact for the foreseeable future. Should copper prices experience a short-term swing higher towards 5.000, it may be appropriate to seek out opportunities to ‘sell the rally.’
— Written by Christopher Vecchio, CFA, Senior Strategist

