

The Index rebounded 0.25% yesterday, ending a three-day losing streak that pressed the index below the critical 4,000 level for the first time since March 2021.
Last month, the gauge suffered its worst April since 1970, shedding 8.8% of its value following disappointing guidance from some mega-cap technology names who warned that the future is less bright amid spiking inflation.
The big question is whether, after a 16% loss year-to-date and a near-18% drop since its Jan. 4 all-time high, the S&P 500 Index has hit the bottom?
We don’t think so.
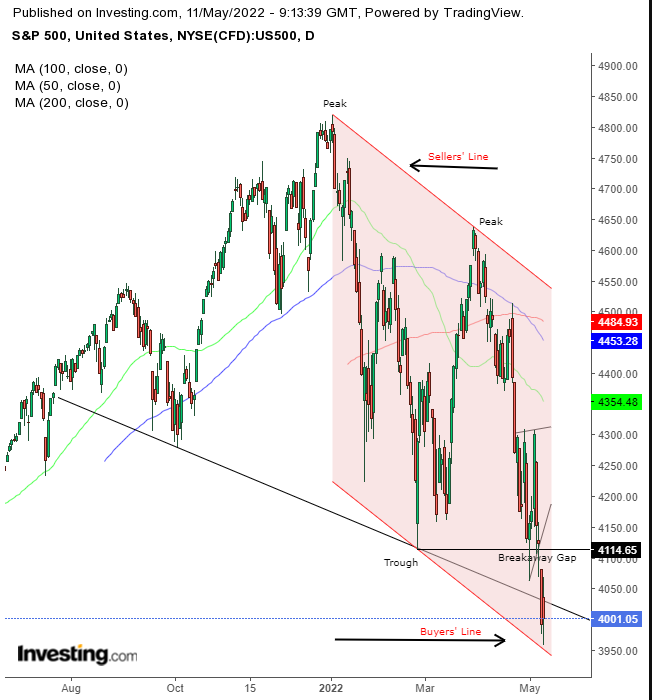
The index completed a Downward Sloping H&S top in Monday’s trading when the gauge closed below the trendline connecting lows. In Wednesday’s trading, dip buyers attempted to take advantage of normalizing valuations. Still, the same trendline, the neckline of the top, affirmed its resistance, as the price closed below it, after peaking above it, but only on an intraday basis.
Earlier, the market took a breather as supply and demand evened out, causing a pause in the trend. However, the downside breakout demonstrates that sellers had the upper hand and were willing to sell at continuously lower prices. At the pennant’s escape point, there were no buyers, only sellers, forming a Breakaway Gap.
Finally, the price has been trading within a Falling Channel, marking the buyers’ and sellers’ lines, demonstrating that both buyers and sellers agree that the price should be lower. However, given that the price bounced off the channel’s bottom, it may rise, at least to the pennant, if not to the channel top. So, beware of whipsaws before a continued downtrend.
The Downward Sloping H&S top’s implied target—as measured by the height between its top and its left shoulder—is about 3,500 if the current breakout endures.
The 50 DMA crossed below the 200 DMA in March, triggering the dreaded Death Cross. The 100 DMA fell below its 200 counterpart a month later, completing a bearish formation in which each MA is below a longer one, demonstrating how current pricing is weakening.
Now, let’s take a step back and look at the bigger picture.
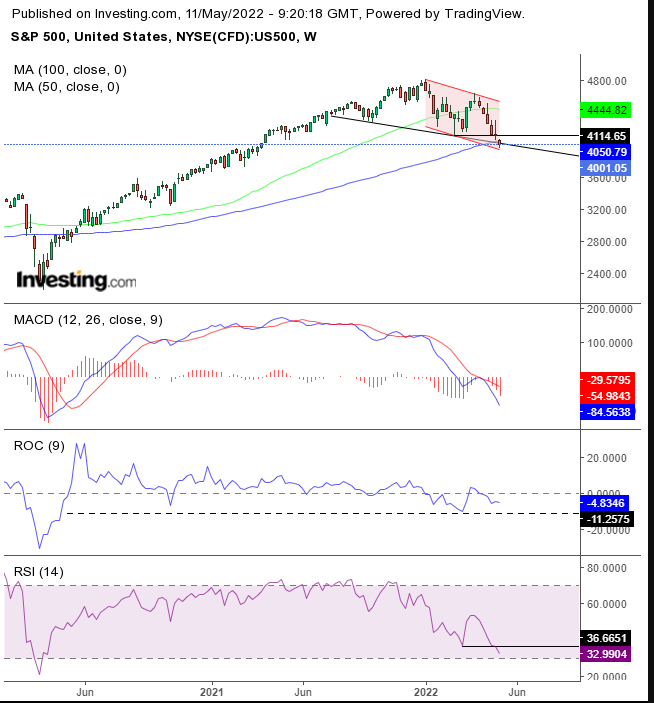
The S&P crossed below the 200 WMA after falling below the 100 WMA. The MACD’s short MA just retested and confirmed the resistance of the long MA, reiterating a bearish signal. The Rate of Change, which measures momentum, has also confirmed the opposition at its 0 lines, below which it fell this year, for the first time since doing so temporarily in October 2020.
Moreover, the recent dip fell below that previous low. Finally, the RSI—another momentum measure—also broke the last support, falling to its lowest since the notorious March 2020 low. On the other hand, as the RSI nears an oversold condition, it increases the chances of a corrective move, corresponding to what we said about the price reaching the bottom of the Falling Channel.
Trading Strategies
Conservative traders should wait for the price to retest the channel top or show resistance below the pennant.
Moderate traders could risk a short with a rebound to the pennant.
Aggressive traders could enter a contrarian, long position, counting on a rebound off the channel bottom, which would jive with a return-move toward the pennant, taking advantage of the proximity to support. Afterward, they would join the rest of the market with a short. Money management is crucial. Here is an example:
Trade Sample – Aggressive Long Position
- Entry: 4,000
- Stop-Loss: 3,950
- Risk: 50 points
- Target: 4,150
- Reward: 150 points
- Risk-Reward Ratio: 1:3
Trade Sample Follow Up – Aggressive Short:
- Entry: 4,200
- Stop-Loss: 4,300
- Risk: 100 points
- Target: 3,900
- Reward: 300 points
- Risk-Reward Ratio: 1:3

