

Key Takeaways
- Cardano remains stagnant, trading within a tight price range.
- This type of price action points to a potential spike in volatility.
- ADA must print a daily close outside $0.48-$0.41 to resolve its current trend.
Share this article
The macroeconomic environment continues to take a toll on the cryptocurrency market as sentiment deteriorates. Although many market participants appear to be waiting on the sidelines, Cardano looks primed for a major price move.
Cardano Continues to Consolidate
Cardano appears to be on the verge of a significant price movement.
ADA has seen its price drop by nearly 17% over the past three weeks. When looking at its daily chart, the downswing came after a rejection from the hypothenuse of a descending triangle formation that started developing in early May. Now, Cardano is edging closer to the pattern’s apex, which anticipates a pronounced spike in volatility.
The height of the triangle’s Y-axis suggests that upon a decisive close above support or below resistance, ADA could stage a 44% price movement. Still, waiting for a clear break of the $0.48 resistance level or the $0.41 support is imperative.
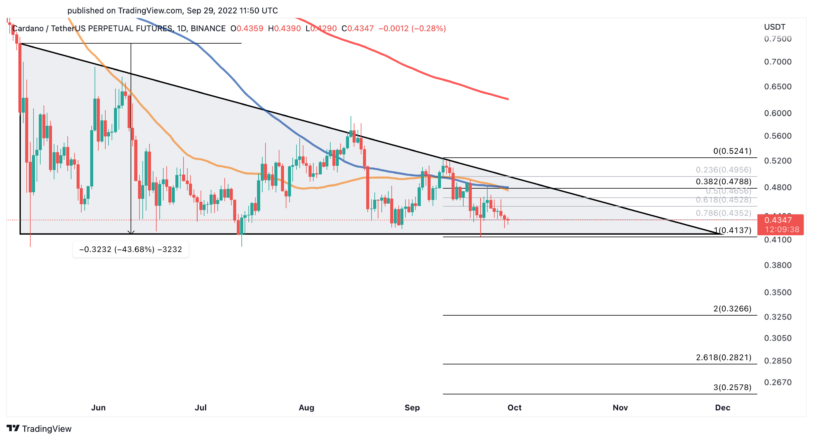
A spike in buying pressure that pushes Cardano above the triangle’s hypothenuse at $0.48 could trigger a bullish breakout. If this were to happen, ADA might gain the strength to surge toward its 200-day moving average at $0.63 or even its May high at $0.69.
However, losing the $0.41 level as support could encourage market participants to exit their long positions, adding downward pressure to Cardano. In this bearish scenario, ADA could resume its downtrend and target $0.33 or $0.25 in case of a sell-off.
Given Cardano’s ambiguous outlook, traders appear to be remaining on the sidelines and waiting for a clear signal before entering any positions. However, global macroeconomic conditions continue to weigh on crypto market sentiment, pushing the Crypto Fear & Greed Index into the “extreme fear” range. It could be difficult for Cardano to break out to the upside if such conditions persist.
Disclosure: At the time of writing, the author of this piece owned BTC and ETH. The information contained in this piece is for educational purposes only and is not investment advice.
For more key market trends, subscribe to our YouTube channel and get weekly updates from our lead bitcoin analyst Nathan Batchelor.

