

US DOLLAR OUTLOOK: BULLISH
- The U.S. dollar, as measured by the DXY index, registers another positive week, supported by higher Treasury rates
- Bond yields surge on hotter-than-expected inflation U.S. CPI data
- Stubbornly high inflationary pressures will keep the Fed on track to deliver additional interest rate increases, supporting the dollar
Recommended by Diego Colman
Get Your Free USD Forecast
Most Read: US Inflation at 8.2%, Dollar and S&P 500 on Diverging Paths on Hot CPI
The U.S. dollar, as measured by the DXY index, rose this past week, up about 0.45% to 113.25 ahead of the weekend, supported by a surge in U.S. Treasury yields following hotter-than-expected U.S. inflation data. While headline annual CPI slowed modestly in September, the core gauge surged to its highest level since 1982, clocking in at 6.6% from 6.3% in August, a sign that price pressures remain stubbornly high in the economy.
With inflation risks skewed to the upside, the Fed is likely to continue to front-load interest rate increases in the coming months, even if the aggressive tightening cycle triggers a painful recession. Indeed, policymakers are now less concerned about the rapidly deteriorating growth profile and appear to be prioritizing the price stability portion of their mandate.
In the current environment, it wouldn’t be surprising if expectations for the FOMC terminal rate move slightly higher than those seen in the futures market and traders begin to discount a restrictive-for-longer monetary policy stance, ruling out the “pivot theory” for now. This scenario should benefit the U.S. dollar insofar as it would keep bond yields biased upwards while bolstering the currency’s “carry premium” over its global peers.
2023 FED FUTURES IMPLIED RATES
Source: TradingView
In terms of technical analysis, the DXY index is hovering slightly below a key resistance near 113.85 after Friday’s advance. If bulls manage to push prices above this barrier in the coming sessions, we could see a move towards the multi-decade high at 114.77, followed by 116.40, the upper limit of a short-term rising wedge. On the flip side, if sellers return and spark a bearish reversal from current levels, initial support appears at 111.00/110.90. On further weakness, the focus shifts lower to 109.80.
US DOLLAR (DXY) TECHNICAL CHART
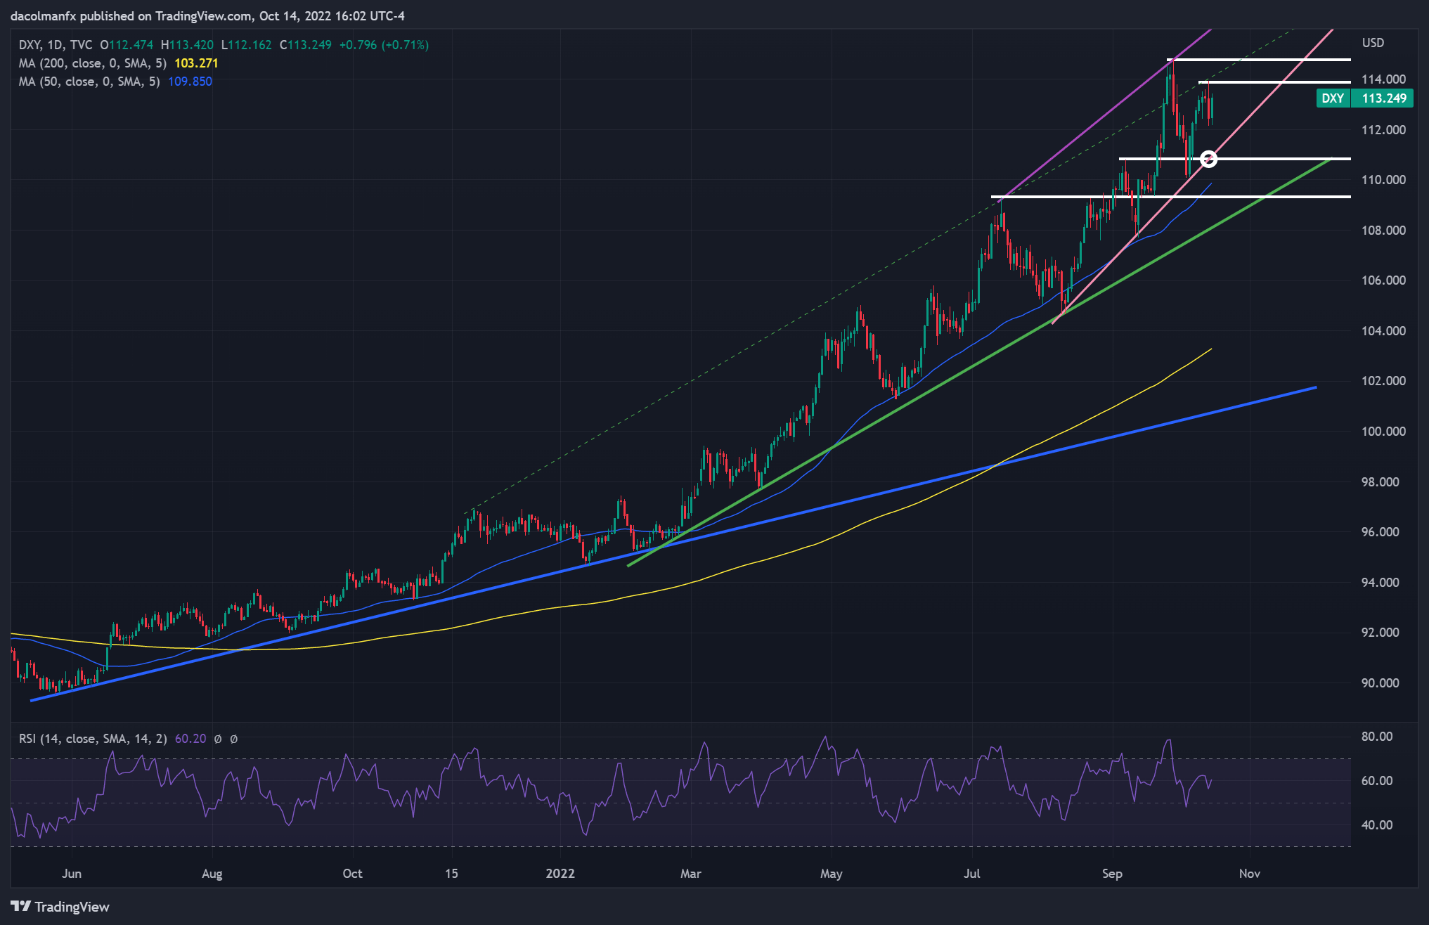
DXY Chart Prepared Using TradingView
Recommended by Diego Colman
Improve your trading with IG Client Sentiment Data
EDUCATION TOOLS FOR TRADERS
- Are you just getting started? Download the beginners’ guide for FX traders
- Would you like to know more about your trading personality? Take the DailyFX quiz and find out
- IG’s client positioning data provides valuable information on market sentiment. Get your free guide on how to use this powerful trading indicator here.
—Written by Diego Colman, Market Strategist for DailyFX

