

Join Our Telegram channel to stay up to date on breaking news coverage
The Bitcoin price indicates a sideways movement as the coin remains below the 9-day and 21-day moving averages.
Bitcoin Prediction Statistics Data:
- Bitcoin price now – $19,712
- Bitcoin market cap – $376 billion
- Bitcoin circulating supply – 19.1 million
- Bitcoin total supply – 19.1 million
- Bitcoin Coinmarketcap ranking – #1
BTC/USD Long-term Trend: Ranging (Daily Chart)
Key levels:
Resistance Levels: $23,000, $25,000, $27,000
Support Levels: $17,000, $15,000, $13,000
Buy Bitcoin Now
Your capital is at risk
BTC/USD is at the moment trading at $19,712, but the king coin has not been able to reclaim the resistance level of $21,000 as the coin consolidates below the 9-day and 21-day moving averages. At the moment, the Bitcoin price may continue to follow the sideways movement, but the daily chart shows that the formation of a bearish movement is likely to play out.
BTC Price May Move Sideways; Massive Gains on TAMA
As the Bitcoin price remains below the 9-day and 21-day moving averages, BTC/USD is likely to cross below the lower boundary of the channel and the technical indicator Relative Strength Index (14) remains below the 50-level. This could mean that the King coin is not yet ready for the upside until the red line of the 9-day moving average crosses above the green line of the 21-day moving average.

However, recovery may not come easy as the bears may bring the king coin below the lower boundary of the channel. Meanwhile, a sustainable move above the 9-day and 21-day moving averages may locate the resistance level of $21,000, which may allow for an extended recovery towards the potential resistance levels at $23,000, $25,000, and $27,000. However, an increase in selling pressure may bring the Bitcoin price towards the supports at $17,000, $15,000, and $13,000.
BTC/USD Medium-term Trend: Bearish (4H Chart)
The Bitcoin price is trading below the 9-day and 21-day moving averages on the 4-hour chart. BTC/USD may cross above 9-day MA as the market is trying to recover from the bearish momentum. Meanwhile, if the price breaks above the moving averages and crosses the upper boundary of the channel, higher resistance could be located at $20,500 and above.
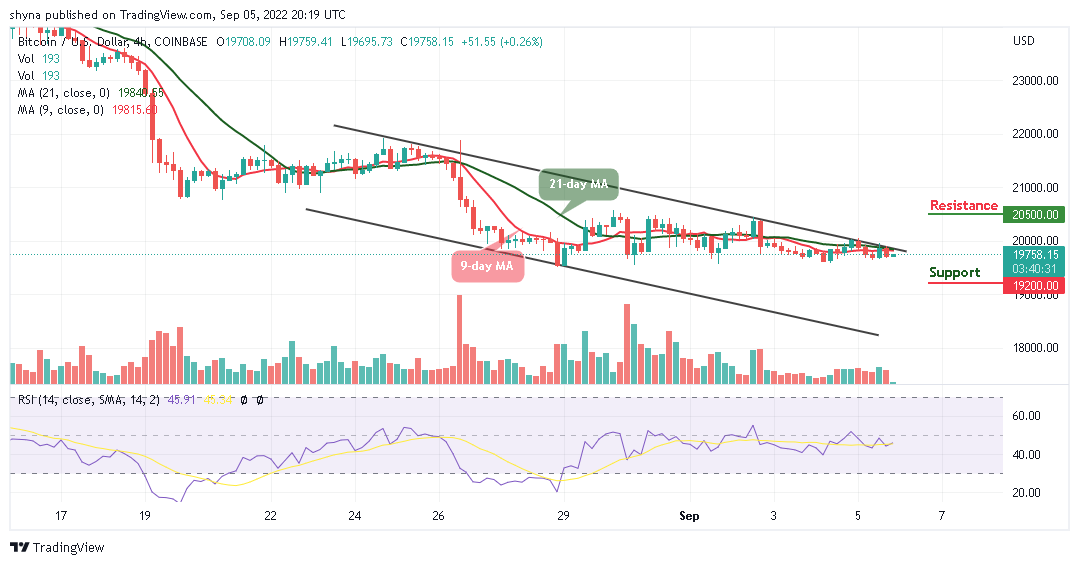
On the contrary, the technical indicator Relative Strength Index (14) is below the 50-level. If the bearish movement steps back, the support level of $19,500 may not be able to hold the selling pressure. Therefore, BTC/USD is likely to fall to $19,200 and below if the price moves towards the lower boundary of the channel.
Tamadoge is combining the fun of Tamagotchi with the play-to-earn mechanics made possible with NFT technology applied to gaming. Earlier this week the project completed the sixth phase on the project in which the coin was priced from 1 USDT to 44 TAMA. The price has since increased, to 1 USDT buying 40 TAMA. There will be nine tranches of token sales in all, with the price increasing at each stage. 711 million tokens have been sold so far out of a total of 1 billion that is available in the presale out of a total supply of 2 billion.
Tamadoge – Play to Earn Meme Coin

- Earn TAMA in Battles With Doge Pets
- Capped Supply of 2 Bn, Token Burn
- NFT-Based Metaverse Game
- Presale Live Now – tamadoge.io
Related:
Join Our Telegram channel to stay up to date on breaking news coverage
