

GBP/USD – Prices, Charts, and Analysis
- UK growth month-on-month turns negative.
- Headline inflation may hit 10%+.
Cable is ending the week on the back foot and looks set to break back below 1.2100 on a combination of a strong US dollar and a weak British Pound. The recent run higher from the July 14 1.1760 low looks to have come to an end as the greenback perks up going into the weekend. Earlier today, the latest UK GDP data showed the UK economy contracting in June on an m/m basis, while the first look at q/q GDP for Q2 showed the economy contracting by 0.1%. While both figures beat analysts’ pessimistic expectations, the slowdown in the UK economy will have been noted by the government and Bank of England.
British Pound Shrugs Off Marginally Better UK Growth Data
The economic outlook is unlikely to get any better next week with the latest jobs, wages, retail sales and inflation all set to be released. While the jobs market remains robust for now, there is a real chance the headline UK inflation could hit double-figures next week. The Bank of England has already warned that inflation may hit 13% this year, while the economy goes into five quarters of recession. With the UK suffering from sky-high energy prices, a political vacuum in No.10, and a drought-inducing heatwave, further bad economic news will rile an already disgruntled population.
For all market-moving economic data and events, refer to the DailyFX calendar
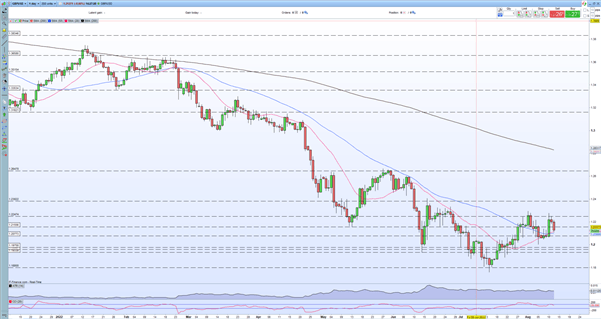
Sterling continues to face headwinds and is likely to struggle against a range of other currencies. GBP/USD is testing 1.2100 again and a break lower would bring sub-1.2000 levels back into play. The daily chart shows the pair continuing to print lower highs, while the CCI indicator is also pointing lower. The 20- and 50-day simple moving averages are in play at the moment and a break and open below these two indicators would add further negative sentiment to the pair.
GBP/USD Daily Price Chart – August 12, 2022
Retail trader data show 66.64% of traders are net-long with the ratio of traders long to short at 2.00 to 1. The number of traders net-long is 10.26% higher than yesterday and 4.81% lower from last week, while the number of traders net-short is 9.45% lower than yesterday and 5.06% lower from last week.
We typically take a contrarian view to crowd sentiment, and the fact traders are net-long suggests GBP/USD prices may continue to fall.Traders are further net-long than yesterday and last week, and the combination of current sentiment and recent changes gives us a stronger GBP/USD-bearish contrarian trading bias.
What is your view on the British Pound – bullish or bearish?? You can let us know via the form at the end of this piece or you can contact the author via Twitter @nickcawley1.

