

Data released by Glassnode suggests Bitcoin long-term holder behavior has shifted from accumulation to distribution recently.
Bitcoin Long-Term Holders Have Shed 222k Coins Off Their Stack Since May
As per a new report from Glassnode, the BTC long-term holders have been spending up to 47k BTC per month in recent days.
The “long-term holders” (or LTH in short) refer to the cohort of Bitcoin investors that have been holding onto their coins since at least 155 days ago, without selling or moving them.
The “LTH net position change” is an indicator that measures the net number of coins that these HODLers have been selling or buying recently.
When the value of this metric is positive, it means LTHs are accumulating right now. On the other hand, the indicator being less than zero implies this group is distributing at the moment.
Now, here is a chart that shows the trend in the Bitcoin LTH net position change over the past year:
Looks like the metric's value has been red in recent days | Source: Glassnode's Market Pulse, 2022-08-05
As you can see in the above graph, the Bitcoin long-term holders started showing deep distribution behavior following the month of May.
However, around three weeks ago, the LTH net position change flipped as these holders began to accumulate. At the peak of this green phase, these investors were hodling at a rate of 79k BTC per month.
But this buying spree didn’t last too long. Soon after, the LTHs again shifted back to a trend of distribution, where they sold at a rate of up to 47k BTC per month. In the past week, the selling has reduced a lot, but the metric’s values still remain red.
Because of all the selling since May, the long-term holder supply has lost around 222k BTC (as of three days ago, when the report released).
The below chart shows how the Bitcoin supply held by LTHs has changed during the last couple of years:
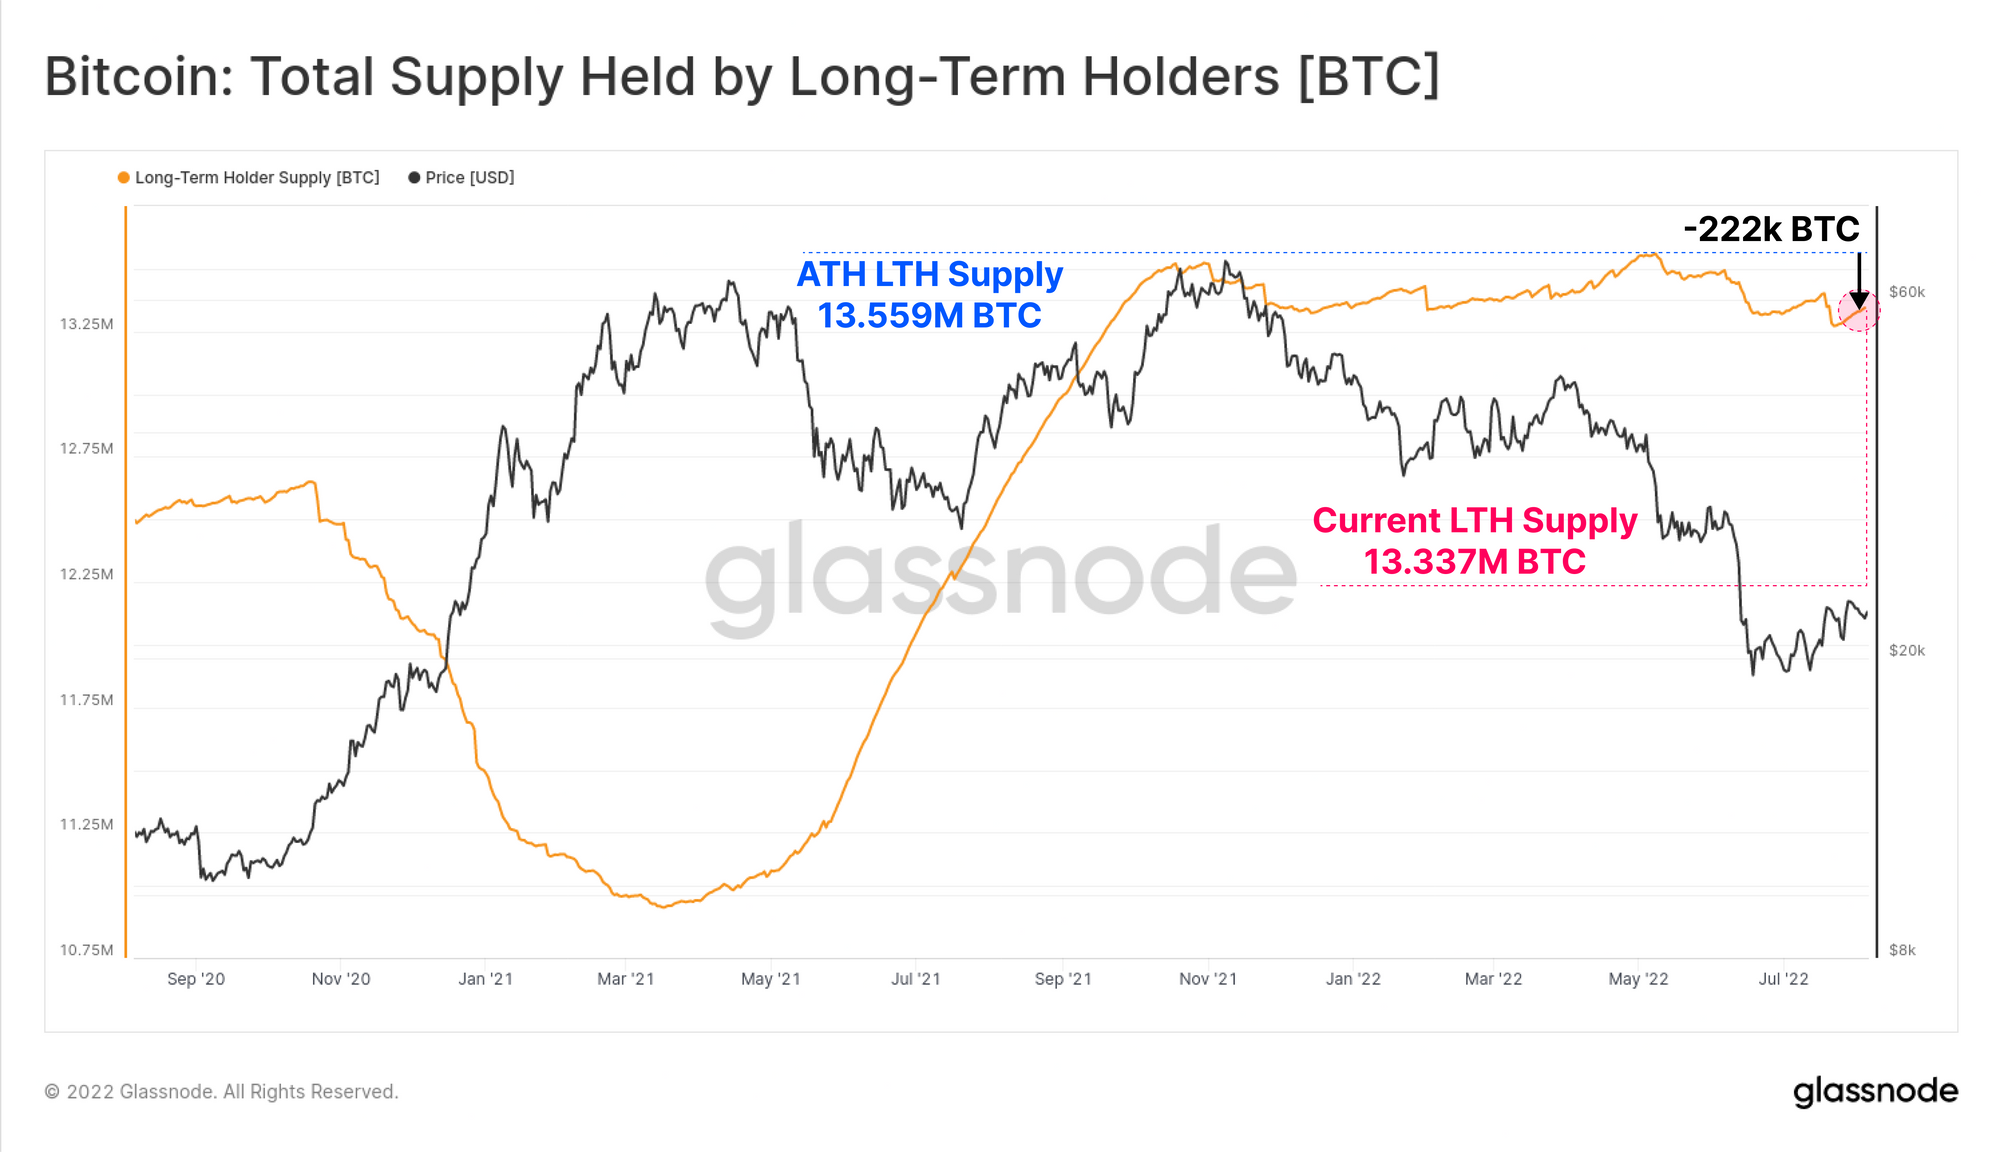
The value of the metric seems to have slid down in recent months | Source: Glassnode's Market Pulse, 2022-08-05
At their all-time high in May, the LTHs held 13.559 million BTC. Since then, their supply has come down by 1.6%.
It remains to be seen what consequences the new shift towards distribution may have for the crypto. The current bullish momentum may not last too long if the selling trend from LTHs continues.
BTC Price
At the time of writing, Bitcoin’s price floats around $24k, up 4% in the last week.

The value of BTC has jumped over the last day | Source: BTCUSD on TradingView
Featured image from Kanchanara on Unsplash.com, charts from TradingView.com, Glassnode.com
