

Updated on May 17th, 2022 by Bob Ciura
Value investing is a broad term, and can mean different things to different investors. Value investors typically look for cheap stocks, although there is no single definition of what constitutes a cheap stock. Generally, value investors look for stocks that are trading below intrinsic value. This is the basic philosophy adhered to by Warren Buffett, arguably the greatest value investor of all time.
Value stocks are often classified by low valuation ratios. While there are many ways to value stocks, the most common valuation metric is the price-to-earnings ratio, otherwise referred to as the P/E ratio. Broadly speaking, value investors typically look for stocks with low P/E ratios.
For this article, value stocks are defined as the 100 stocks in the Russell 2000 with the lowest trailing price-to-earnings ratios. With this in mind, we compiled a list of these 100 value stocks.
You can download a free copy of the value stocks spreadsheet—with relevant financial metrics like P/E ratios and dividend yields included—by clicking on the link below:
This article will discuss our valuation methodology, as well as our top 3 picks from the Value Stocks spreadsheet above. We believe these 3 picks represent the best value stocks with the highest expected returns over the next five years, as ranked using expected total returns from the Sure Analysis Research Database.
Table Of Contents
You can instantly jump to a specific section of the article by using the following table of contents:
Breaking Down The P/E Ratio
The price-to-earnings ratio, or P/E ratio, is perhaps the most frequently-utilized valuation metric for stock investors. The P/E ratio essentially values stocks based on a multiple of the company’s earnings-per-share. It is calculated by dividing the stock price by the company’s earnings-per-share. The earnings-per-share of a company represents its net income on a per-share basis. This can be found on a company’s income statement.
P/E ratios can either be calculated on a trailing basis (by using the company’s trailing 12-month EPS) or on a forward basis (by using the company’s expected EPS over the next 12 months). The advantage of the trailing multiple is that it uses verifiable EPS results instead of a projection which may or may not materialize, while the forward P/E ratio allows investors to look ahead, which many investors believe is more predictive.
Consider a stock that has a current share price of $100, and earnings-per-share of $5.00. In this case, the stock has a P/E ratio of 20 on a trailing basis. There are only two reasons why the stock price would rise above $100. Either the company grows its earnings-per-share, or the P/E ratio expands above 20.
For example, if EPS increases to $6.00 in the following year, the same P/E ratio of 20 would result in a share price of $120, for a 20% gain. The stock price could still rise to $120 (or higher) without the underlying EPS growth, but the P/E ratio would rise as a result. To that end, if EPS remain flat at $5.00 and the share price rises to $120, the P/E ratio would expand to 24.
Consequently, when it comes to movement in share prices, returns are generated for investors either through earnings-per-share growth, or a rising P/E ratio. In our view, the best investments are stocks that deliver a combination of growing EPS, an expanding P/E ratio, and dividends.
A Real-Life Example Of An Overvalued Stock
To illustrate the potential impact that valuation can have on future returns, consider the example of an overvalued stock.
Consider the case of healthcare giant Eli Lilly (LLY). Eli Lilly is a classic example of a great company, trading at an unfavorable valuation. Shares of Eli Lilly have generated impressive annualized returns of 33.2% per year in the past five years. However, we believe the stock has become overvalued.
Based on expected EPS of $8.23, Eli Lilly stock now trades at a price-to-earnings ratio above 36. This is a very high valuation that is well ahead of its peers in the healthcare industry. Our fair value estimate for Eli Lilly stock is a P/E of 17.5 which is more in-line with the stock’s long-term historical valuation. This implies significant downside risk for Eli Lilly at the current valuation level.
If the stock valuation declines to our fair value estimate, it would represent a -13.6% annual drag on shareholder returns over the next five years. Even with expected EPS growth of 6% and the 1.3% dividend yield, Eli Lilly is still expected to generate negative total returns in the next five years. As a result, we rate Eli Lilly stock a sell, demonstrating the impact of valuation on expected returns.
Therefore, it is clear that investor returns can fluctuate significantly, based on the valuation at the time of purchase.
The Top 3 Value Stocks Today
The following list represents our top 3 stocks from the Value Stocks spreadsheet. The stocks on the list represent the 100 lowest forward P/E stocks in the Russell 2000.
These 3 stocks have the highest total return potential over the next five years from the Value Stocks sheet, due to a combination of a rising valuation multiple, future earnings growth, and dividends. Stock picks are ranked by 5-year expected annual return, in order of lowest to highest.
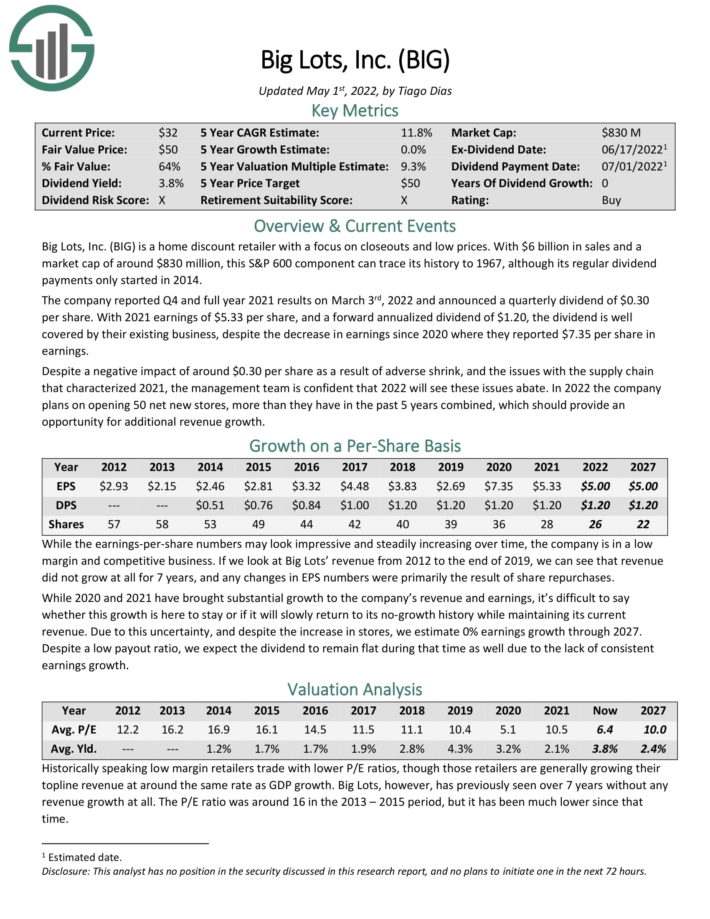
Value Stock #3: Big Lots Inc. (BIG)
- 5-year expected annual returns: 11.4%
Big Lots is a home discount retailer with a focus on closeouts and low prices. With $6 billion in sales and a
market cap of around $956 million, this S&P 600 component can trace its history to 1967.
Source: Investor Presentation
The company reported Q4 and full year 2021 results on March 3rd, 2022 and announced a quarterly dividend of $0.30 per share. With 2021 earnings of $5.33 per share, and a forward annualized dividend of $1.20, the dividend is well covered by their existing business, despite the decrease in earnings since 2020 where they reported $7.35 per share in earnings.
Despite a negative impact of around $0.30 per share as a result of adverse shrink, and the issues with the supply chain that characterized 2021, the management team is confident that 2022 will see these issues abate. In 2022 the company plans on opening 50 net new stores, more than they have in the past 5 years combined, which should provide an opportunity for additional revenue growth.
Big Lots stock has a P/E of 5.2, making it a deep-value stock. Shares also have a dividend yield of 3.6%, while we expect no EPS growth. Total returns are estimated at 11.4% over the next five years.
Click here to download our most recent Sure Analysis report on Big Lots (preview of page 1 of 3 shown below):
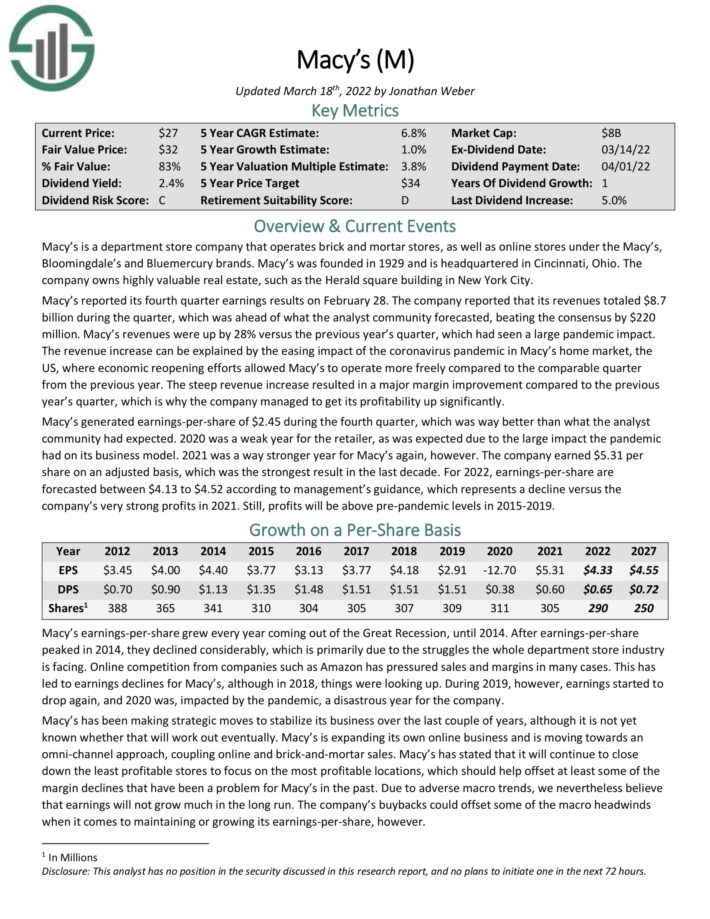
Value Stock #2: Macy’s Inc. (M)
- 5-year expected annual returns: 12.1%
Macy’s is a department store company that operates brick and mortar stores, as well as online stores under the Macy’s, Bloomingdale’s and Bluemercury brands. Macy’s was founded in 1929 and is headquartered in Cincinnati, Ohio. The company owns highly valuable real estate, such as the Herald square building in New York City.
Macy’s reported its fourth quarter earnings results on February 28. The company reported that its revenues totaled $8.7 billion during the quarter, which was ahead of forecasts, beating the consensus by $220 million. Macy’s revenues were up by 28% versus the previous year’s quarter, which had seen a large pandemic impact.
The revenue increase can be explained by the easing impact of the coronavirus pandemic in Macy’s home market, the US, where economic reopening efforts allowed Macy’s to operate more freely compared to the comparable quarter from the previous year. The steep revenue increase resulted in a major margin improvement compared to the previous year’s quarter, which is why the company managed to get its profitability up significantly.
Macy’s is also seeing strong growth due to its transformation into a multi-channel retailer.
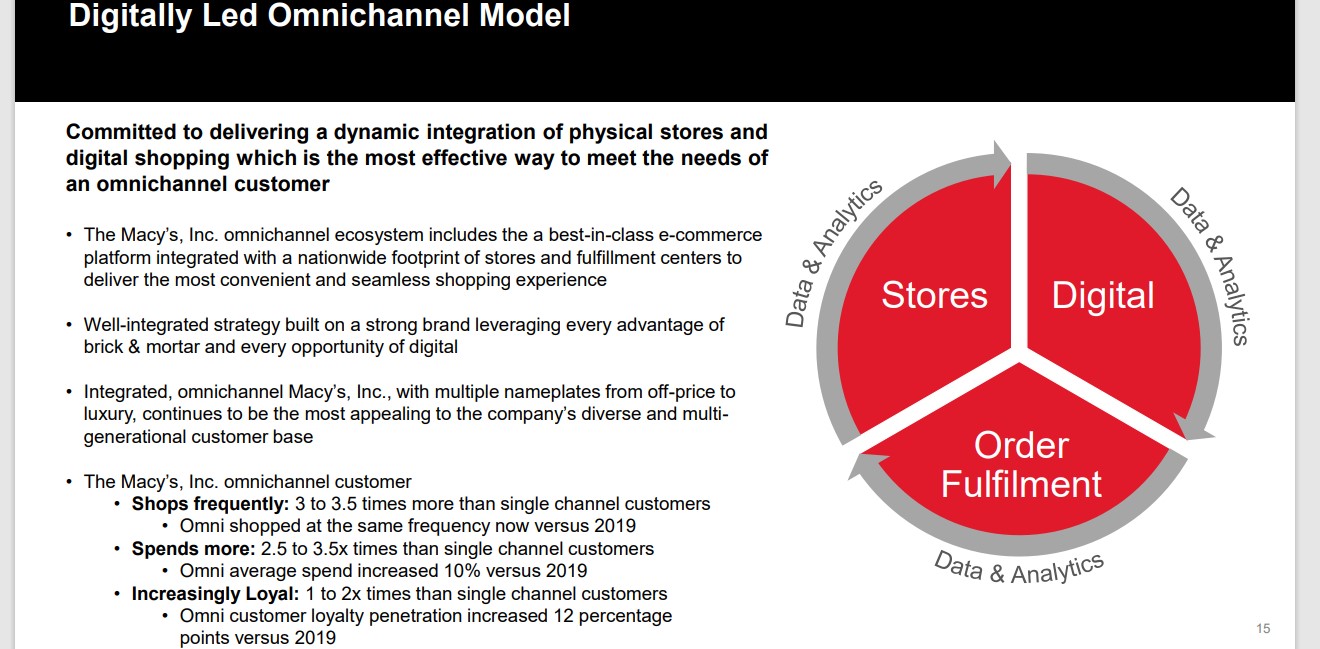
Source: Investor Presentation
Macy’s generated earnings-per-share of $2.45 during the fourth quarter, which was way better than what the analyst
community had expected. 2020 was a weak year for the retailer, as was expected due to the large impact the pandemic had on its business model. 2021 was a way stronger year for Macy’s again, however. The company earned $5.31 per share on an adjusted basis, which was the strongest result in the last decade.
Macy’s stock has a P/E of 4.2, making it a deep-value stock. Shares also have a dividend yield of 2.2%, and we expect the company to grow its earnings-per-share by 1% per year. Total returns are estimated at 12.1% over the next five years.
Click here to download our most recent Sure Analysis report on Macy’s (preview of page 1 of 3 shown below):
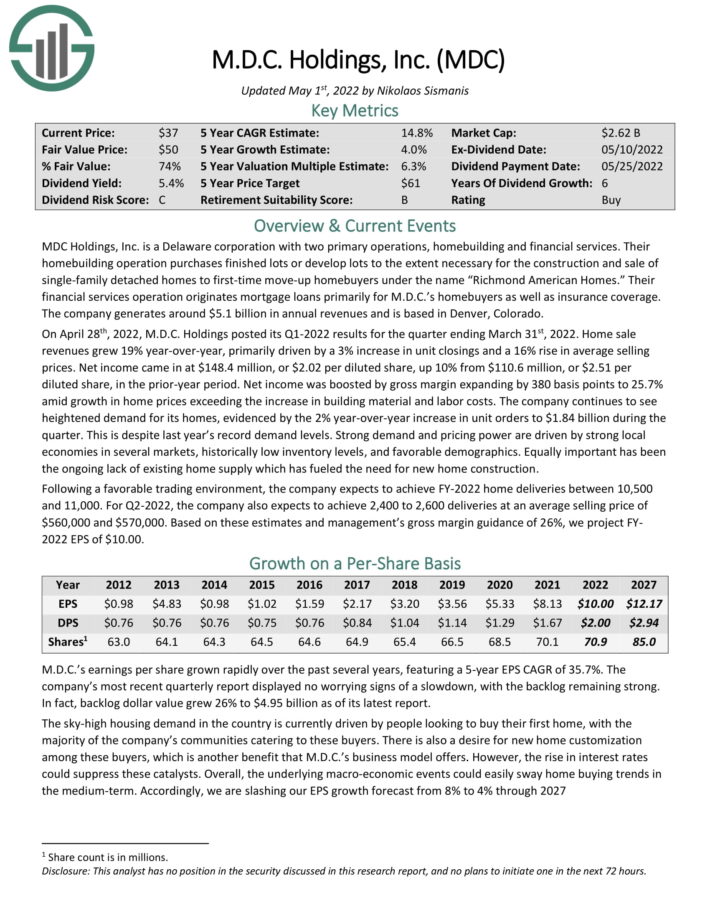
Value Stock #1: M.D.C Holdings (MDC)
- 5-year expected annual returns: 14.8%
M.D.C. Holdings has two primary operations, home building and financial services. Its home building operation purchases finished lots or develops lots to the extent necessary for the construction and sale of single-family detached homes to home buyers under the name “Richmond American Homes.” Its financial services operation issues mortgage loans primarily for the home buyers of the company while it also sells insurance coverage.
Due to the nature of its business, M.D.C. Holdings has always been highly vulnerable to recessions, as demand for new homes plunges during rough economic periods. In the Great Recession, the quarterly sales of M.D.C. Holdings plunged 99% within just a few quarters and the company incurred hefty losses.
However, M.D.C. Holdings has proved markedly resilient throughout the coronavirus crisis. Despite the fierce recession caused by the unprecedented lockdowns imposed in 2020, the home builder grew its earnings per share 50% in that year, from $3.56 to $5.33.
Even better, thanks to the excessive fiscal stimulus packages offered by the government and strong pent-up demand, M.D.C. Holdings posted blowout results in 2021.
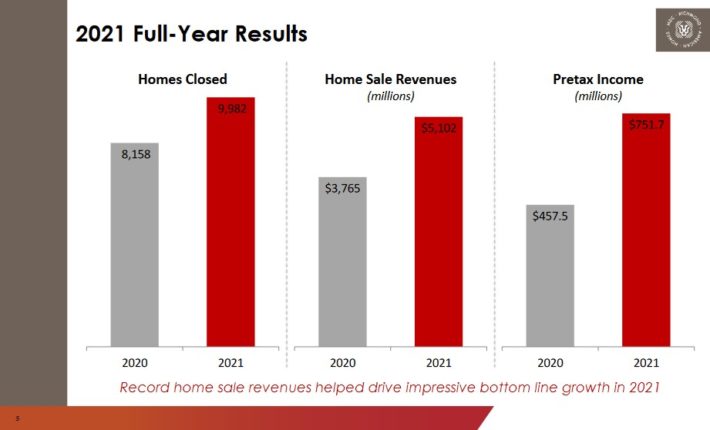
Source: Investor Presentation
The company grew its home sale units by 22%, from 8,158 to a record 9,982, and its earnings per share by 53%, from $5.33 to a new all-time high of $8.13.
Even better, the business momentum remains strong. In the fourth quarter, the company grew its home sale revenues 22% over the prior year’s quarter thanks to a 4% increase in new units and a 17% increase in average selling prices. As a result, it grew its earnings per share 10%.
Thanks to lack of existing home supply and pent-up demand, M.D.C. Holdings is likely to continue to enjoy strong pricing power for the foreseeable future. It also has a record backlog of $4.3 billion.
Management expects 10,500-11,000 home deliveries in 2022, which correspond to 5%-10% growth vs. 2021, and a gross margin around 25%, a significant improvement from 20.8% in 2020 and 23.1% in 2021.
MDC stock has a trailing price-to-earnings ratio of 4.3. The stock also has a 5.4% dividend yield, while we expect 4% annual EPS growth over the next five years. Total returns are expected to reach 14.8% per year through 2027.
Click here to download our most recent Sure Analysis report on MDC (preview of page 1 of 3 shown below):
Final Thoughts
Value investing is all about buying stocks when they are undervalued. But just because a stock has a low P/E ratio, does not automatically make it a buy. Investors still need to perform fundamental analysis to determine the company’s business outlook. Sometimes, stocks appear cheap on the surface because they have low P/E ratios, but amount to value traps as the business model is deteriorating.
In addition to low P/E ratios, the three stocks on this list also have positive future growth potential, and high dividend yields. We expect high total returns from these stocks over the next five years.
Other Dividend Lists
Value investing is a valuable process to combine with dividend investing. The following lists contain many more high-quality dividend stocks:
Thanks for reading this article. Please send any feedback, corrections, or questions to [email protected].
