

Updated on July 5th, 2022 by Bob Ciura
Spreadsheet data updated daily
The Dividend Kings are the best-of-the-best in dividend longevity.
What is a Dividend King? A stock with 50 or more consecutive years of dividend increases.
The downloadable Dividend Kings Spreadsheet List below contains the following for each stock in the index among other important investing metrics:
- Payout ratio
- Dividend yield
- Price-to-earnings ratio
You can see the full downloadable spreadsheet of all 44 Dividend Kings (along with important financial metrics such as dividend yields, payout ratios, and price-to-earnings ratios) by clicking on the link below:
The Dividend Kings list includes recent additions such as Tennant Company (TNC), PepsiCo (PEP), Kimberly-Clark (KMB), Abbott Laboratories (ABT), AbbVie (ABBV), Leggett & Platt (LEG), and W.W. Grainger (GWW).
Each Dividend King satisfies the primary requirement to be a Dividend Aristocrat (25 years of consecutive dividend increases) twice over.
Not all Dividend Kings are Dividend Aristocrats.
This unexpected result is because the ‘only’ requirement to be a Dividend Kings is 50+ years of rising dividends.
On the other hand, Dividend Aristocrats must have 25+ years of rising dividends, be a member of the S&P 500 Index, and meet certain minimum size and liquidity requirements.
Table of Contents
How To Use The Dividend Kings List to Find Dividend Stock Ideas
The Dividend Kings list is a great place to find dividend stock ideas. However, not all the stocks in the Dividend Kings list make a great investment at any given time.
Some stocks might be overvalued. Conversely, some might be undervalued – making great long-term holdings for dividend growth investors.
For those unfamiliar with Microsoft Excel, the following walk-through shows how to filter the Dividend Kings list for the stocks with the most attractive valuation based on the price-to-earnings ratio.
Step 1: Download the Dividend Kings Excel Spreadsheet.
Step 2: Follow the steps in the instructional video below. Note that we screen for price-to-earnings ratios of 15 or below in the video. You can choose any threshold that best defines ‘value’ for you.
Alternatively, following the instructions above and filtering for higher dividend yield Dividend Kings (yields of 2% or 3% or higher) will show stocks with 50+ years of rising dividends and above-average dividend yields.
Looking for businesses that have a long history of dividend increases isn’t a perfect way to identify stocks that will increase their dividends every year in the future, but there is considerable consistency in the Dividend Kings.
The 5 Best Dividend Kings Today
The following 5 stocks are our top-ranked Dividend Kings today, based on expected annual returns over the next 5 years. Stocks are ranked in order of lowest to highest expected annual returns.
Total returns include a combination of future earnings-per-share growth, dividends, and any changes in the P/E multiple.
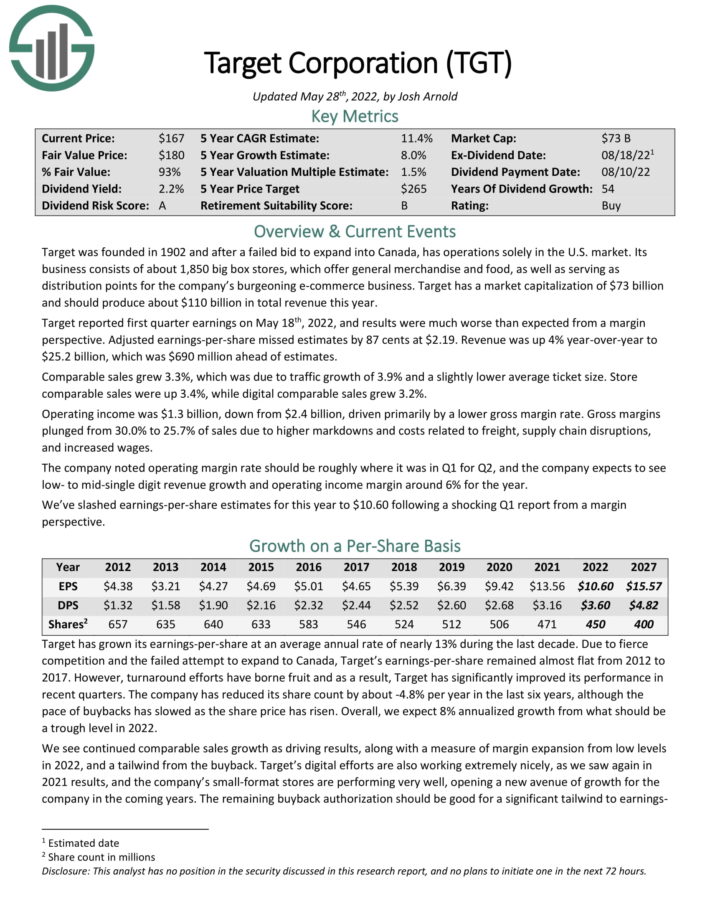
Dividend King #5: Target Corporation (TGT)
- 5-Year Annual Expected Returns: 15.1%
Target is a giant discount retailer. Its business consists of about 1,850 big box stores, which offer general merchandise and food, as well as serving as distribution points for the company’s burgeoning e-commerce business. Target should produce about $110 billion in total revenue this year.
Target reported first quarter earnings on May 18th, 2022, and results were much worse than expected from a margin perspective. Adjusted earnings-per-share missed estimates by 87 cents at $2.19. Revenue was up 4% year-over-year to $25.2 billion, which was $690 million ahead of estimates.
Comparable sales grew 3.3%, which was due to traffic growth of 3.9% and a slightly lower average ticket size. Store comparable sales were up 3.4%, while digital comparable sales grew 3.2%. Operating income was $1.3 billion, down from $2.4 billion, driven primarily by a lower gross margin rate. Gross margins plunged from 30.0% to 25.7% of sales due to higher markdowns and costs related to freight, supply chain disruptions, and increased wages.
The company noted operating margin rate should be roughly where it was in Q1 for Q2, and the company expects to see low- to mid-single digit revenue growth and operating income margin around 6% for the year.
We expect Target to grow EPS by 8% per year. In addition, the stock has a 3% dividend yield, while an expanding valuation is expected to add ~4.1% per year over the next five years. Total returns are expected to reach 15.1% per year.
Click here to download our most recent Sure Analysis report on Target (preview of page 1 of 3 shown below):
Dividend King #4: Parker-Hannifin (PH)
- 5-Year Annual Expected Returns: 15.2%
Parker-Hannifin is a diversified industrial manufacturer specializing in motion and control technologies. The company was founded in 1917 and has annual revenues of over $14 billion.
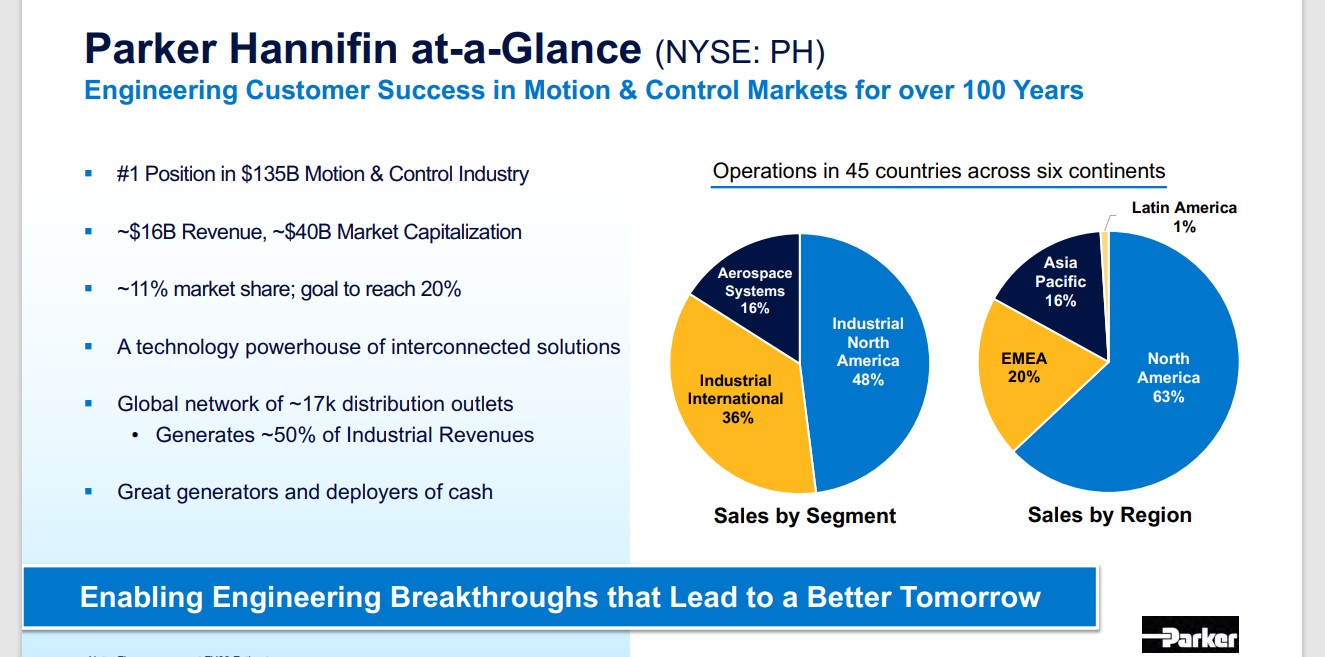
Source: Investor Presentation
Parker-Hannifin has paid a dividend for 71 years and has increased that dividend for a remarkable 65 consecutive years.
In early May, Parker-Hannifin reported (5/5/21) financial results for the third quarter of fiscal 2022. Sales grew 9% over the prior year’s quarter and adjusted earnings-per-share grew 17%, from $4.12 to $4.83, thanks to strong demand in nearly all markets, which more than offset the headwind of cost inflation.
Parker-Hannifin exceeded analysts’ consensus by $0.18 and posted record sales and earnings-per-share. It also narrowed its guidance for adjusted earnings-per-share in fiscal 2022 from $17.80-$18.30 to $18.00-$18.30 and raised the dividend by 29%.
We expect total returns of 15.2% per year, driven by 9% EPS growth, the 2.1% dividend yield, and a ~4.1% annual boost from a rising P/E ratio.
Click here to download our most recent Sure Analysis report on Parker-Hannifin (preview of page 1 of 3 shown below):
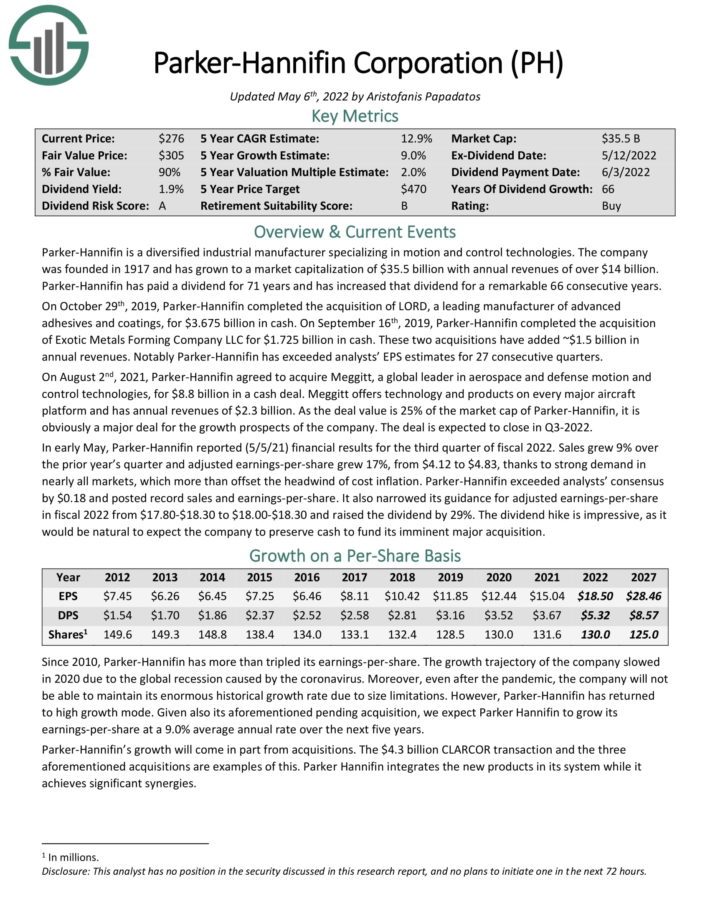
Dividend King #3: Lowe’s Companies (LOW)
- 5-Year Annual Expected Returns: 15.8%
Lowe’s Companies is the second-largest home improvement retailer in the US (after Home Depot). Lowe’s operates or services more than 2,200 home improvement and hardware stores in the U.S. and Canada.
Lowe’s reported first quarter 2022 results on May 18th. Total sales for the first quarter came in at $23.7 billion compared to $24.4 billion in the same quarter a year ago. Comparable sales decreased 4%, while U.S. home improvement comparable sales decreased 3.8%.
Of note, pro customer sales rose 20% year-over-year. Net earnings of $2.3 billion was in-line with results from Q1 2021. Diluted earnings per share of $3.51 was a 9.3% increase from $3.21 a year earlier.
The company repurchased 19 million shares in the first quarter for $4.1 billion. Additionally, they paid out $537 million in dividends. The company remains in a strong liquidity position with $3.4 billion of cash and cash equivalents.
The company provided a fiscal 2022 outlook and believes they can achieve diluted EPS in the range of $13.10 to $13.60 on total sales of roughly $98 billion. Lowe’s expects to repurchase $12 billion worth of common shares in 2022.
The combination of multiple expansion, 6% expected EPS growth and the 2.4% dividend yield lead to total expected returns of 15.8% per year.
Click here to download our most recent Sure Analysis report on Lowe’s (preview of page 1 of 3 shown below):
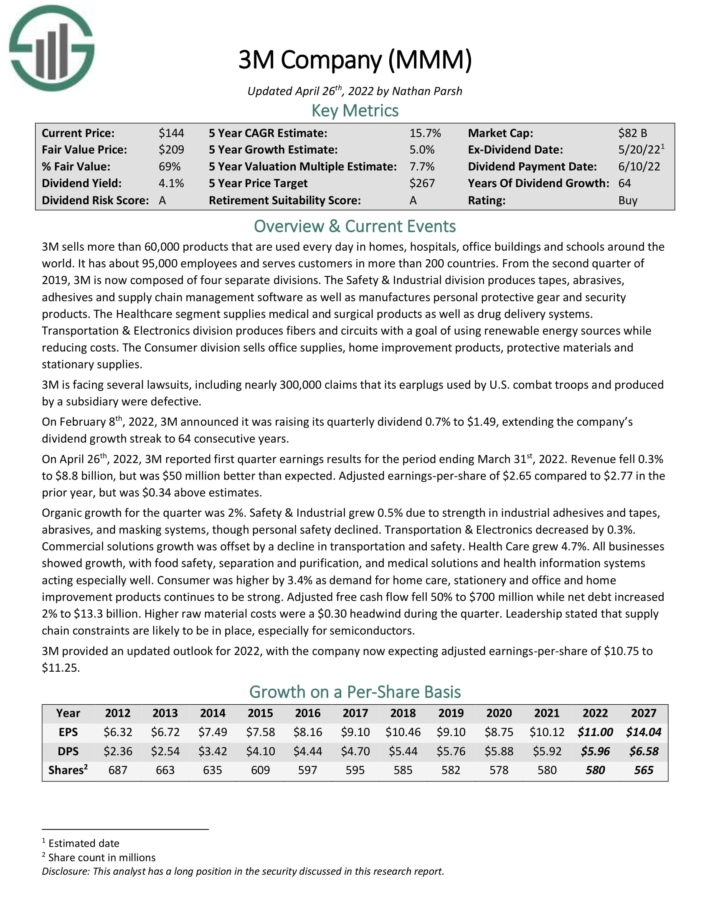
Dividend King #2: 3M Company (MMM)
- 5-Year Annual Expected Returns: 18.4%
3M sells more than 60,000 products that are used every day in homes, hospitals, office buildings and schools around the world. It has about 95,000 employees and serves customers in more than 200 countries.
3M is now composed of four separate divisions. The Safety & Industrial division produces tapes, abrasives, adhesives, and supply chain management software as well as manufactures personal protective gear and security products.
The Healthcare segment supplies medical and surgical products as well as drug delivery systems. The Transportation & Electronics division produces fibers and circuits with a goal of using renewable energy sources while reducing costs. The Consumer division sells office supplies, home improvement products, protective materials, and stationary supplies.
On April 26th, 2022, 3M reported first quarter earnings results for the period ending March 31st, 2022. Revenue fell 0.3% to $8.8 billion, but was $50 million better than expected. Adjusted earnings-per-share of $2.65 compared to $2.77 in the prior year, but was $0.34 above estimates. Organic growth for the quarter was 2%.
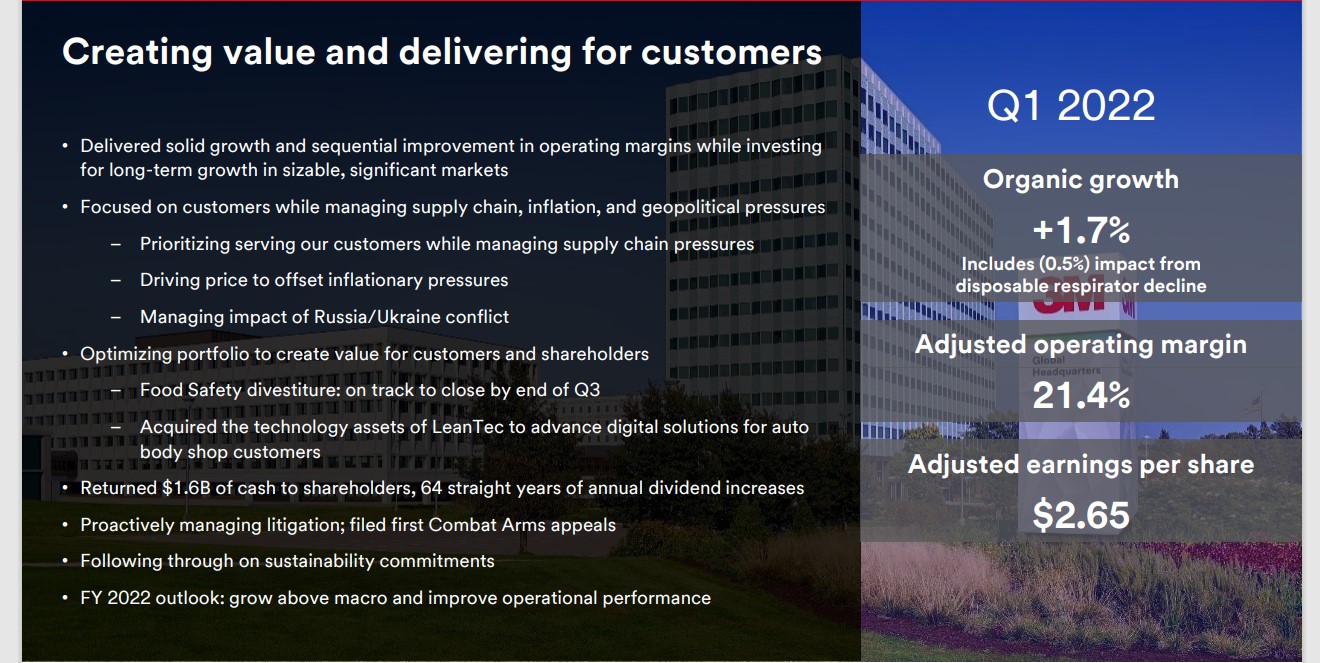
Source: Investor Presentation
Safety & Industrial grew 0.5% due to strength in industrial adhesives and tapes, abrasives, and masking systems, though personal safety declined. Transportation & Electronics decreased by 0.3%. Commercial solutions growth was offset by a decline in transportation and safety. Health Care grew 4.7%. Consumer was higher by 3.4% as demand for home care, stationery and office and home improvement products continues to be strong.
3M provided an updated outlook for 2022, with the company now expecting adjusted earnings-per-share of $10.75 to $11.25. Total returns are expected to reach 18.4% per year over the next five years.
Click here to download our most recent Sure Analysis report on 3M (preview of page 1 of 3 shown below):
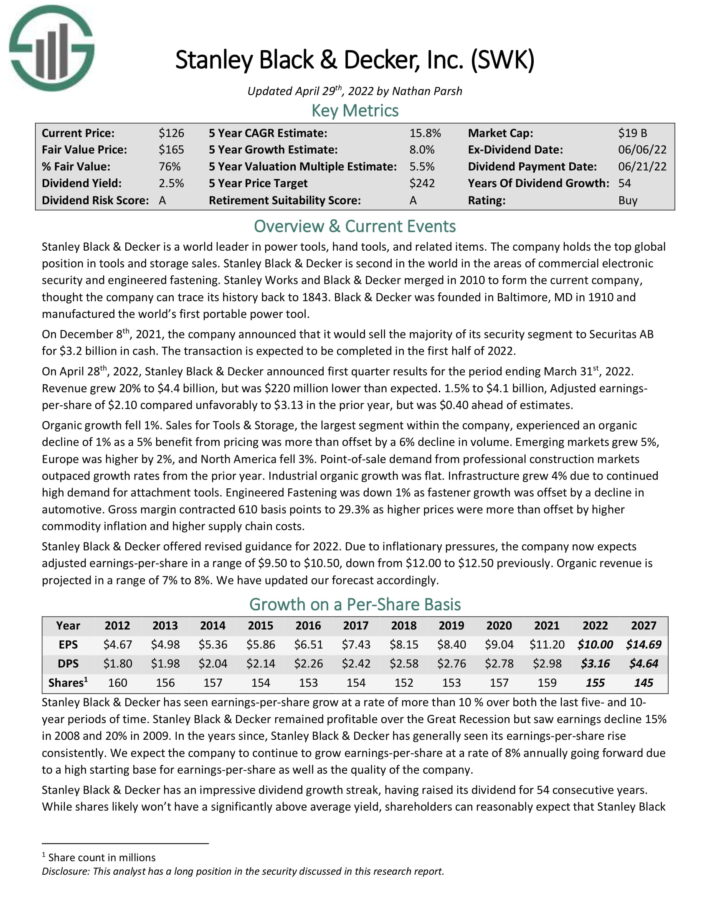
Dividend King #1: Stanley Black & Decker (SWK)
- 5-Year Annual Expected Returns: 19.6%
Stanley Black & Decker is a world leader in power tools, hand tools, and related items. The company holds the top global position in tools and storage sales. Stanley Black & Decker is second in the world in the areas of commercial electronic security and engineered fastening.
You can see an overview of the company’s 2022 first-quarter performance in the image below:
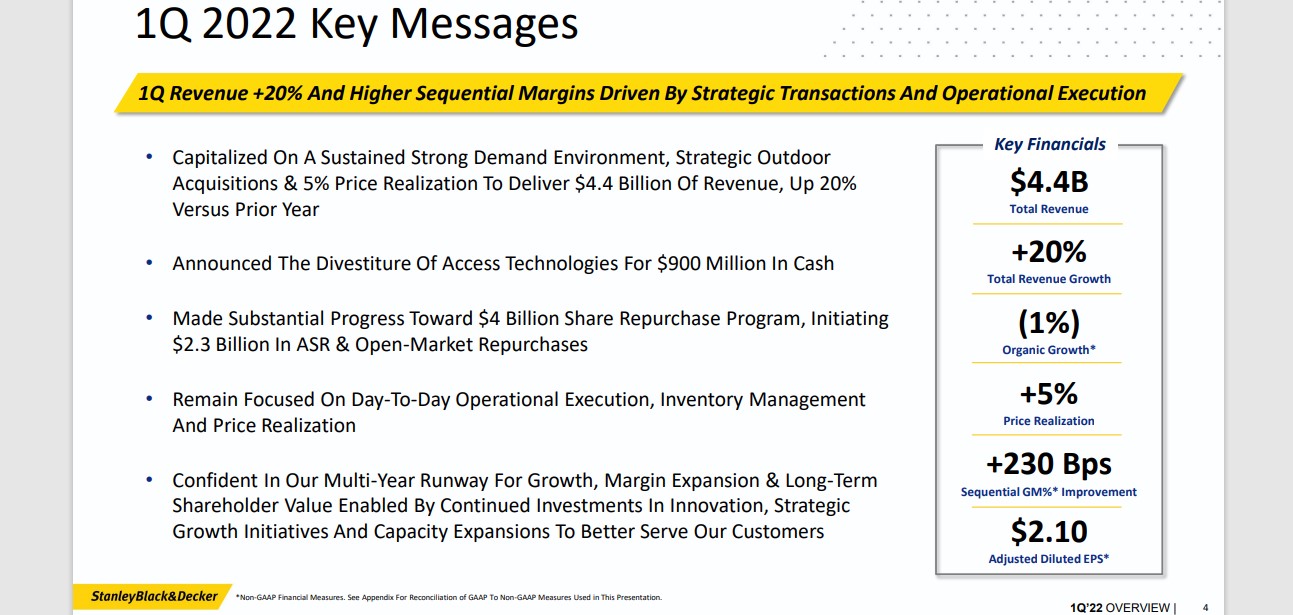
Source: Investor Presentation
On April 28th, 2022, Stanley Black & Decker announced first quarter results. Revenue grew 20% to $4.4 billion, but was $220 million lower than expected. Adjusted earnings-per-share of $2.10 compared unfavorably to $3.13 in the prior year, but was $0.40 ahead of estimates. Organic growth fell 1%.
Stanley Black & Decker offered revised guidance for 2022. Due to inflationary pressures, the company now expects adjusted earnings-per-share in a range of $9.50 to $10.50, down from $12.00 to $12.50 previously. Organic revenue is projected in a range of 7% to 8%.
The stock has a 2.9% dividend yield, and we expect 8% annual EPS growth. With a ~8.7% annual boost from an expanding P/E multiple, total returns are expected to reach 19.6% per year.
Click here to download our most recent Sure Analysis report on SWK (preview of page 1 of 3 shown below):
Analysis Reports On All 44 Dividend Kings
All 44 Dividend Kings are listed below by sector. You can access detailed coverage of each by clicking on the name of each Dividend King. Additionally, you can download our newest Sure Analysis Research Database report for each Dividend King as well.
Basic Materials
Consumer Cyclical
Consumer Staples
Energy
Financial Services
Healthcare
Industrial
Real Estate
Technology
Utilities
Performance Of The Dividend Kings
The Dividend Kings underperformed versus the S&P 500 ETF (SPY) in June 2022. Return data for the month is shown below:
- Dividend Kings June 2022 total return: -5.3%
- SPY June 2022 total return: -8.2%
Stable dividend growers like the Dividend Kings tend to underperform in bull markets and outperform on a relative basis during bear markets.
The Dividend Kings are not officially regulated and monitored by any one company. There’s no Dividend King ETF. This means that tracking the historical performance of the Dividend Kings can be difficult. More specifically, performance tracking of the Dividend Kings often introduces significant survivorship bias.
Survivorship bias occurs when one looks at only the companies that ‘survived’ the time period in question. In the case of Dividend Kings, this means that the performance study does not include ex-Kings that reduced their dividend, were acquired, etc.
But with that said, there is something to be gained from investigating the historical performance of the Dividend Kings. Specifically, the performance of the Dividend Kings shows that ‘boring’ established blue-chip stocks that increase their dividend year-after-year can significantly outperform over long periods of time.
Notes: S&P 500 performance is measured using the S&P 500 ETF (SPY). The Dividend Kings performance is calculated using an equal weighted portfolio of today’s Dividend Kings, rebalanced annually. Due to insufficient data, Farmers & Merchants Bancorp (FMCB) returns are from 2000 onward. Performance excludes previous Dividend Kings that ended their streak of dividend increases which creates notable lookback/survivorship bias. The data for this study is from Ycharts.
In the next section of this article, we will provide an overview of the sector and market capitalization characteristics of the Dividend Kings.
Sector & Market Capitalization Overview
The sector and market capitalization characteristics of the Dividend Kings are very different from the characteristics of the broader stock market.
The following bullet points show the number of Dividend Kings in each sector of the stock market.
- Consumer Staples: 11
- Industrials: 11
- Utilities: 5
- Consumer Discretionary: 4
- Health Care: 4
- Financials: 3
- Materials: 3
- Real Estate: 1
- Energy: 1
- Technology: 1
The Dividend Kings are overweight in the Industrials, Consumer Staples, and Utilities sectors. Interestingly, The Dividend Kings have just one stock from the Information Technology sector, which is the largest component of the S&P 500 index.
The Dividend Kings also have some interesting characteristics with respect to market capitalization. These trends are illustrated below.
- 5 Mega caps ($200 billion+ market cap; ABBV, JNJ, PEP, PG, and KO)
- 20 Large caps ($10 billion to $200 billion market cap)
- 13 Mid caps ($2 billion to $10 billion)
- 6 Small caps ($300 million to $2 billion)
Interestingly, 19 out of the 44 Dividend Kings have market capitalizations below $10 billion. This shows that corporate longevity doesn’t have to be accompanied by massive size.
Final Thoughts
Screening to find the best Dividend Kings is not the only way to find high-quality dividend growth stock ideas.
Sure Dividend maintains similar databases on the following useful universes of stocks:
There is nothing magical about investing in the Dividend Kings. They are simply a group of high-quality businesses with shareholder-friendly management teams that have strong competitive advantages.
Purchasing businesses with these characteristics at fair or better prices and holding them for long periods of time will likely result in strong long-term investment performance.
The most appealing part of investing is that you have unlimited choice. You can buy into mediocre businesses, or just the excellent companies.
As Warren Buffett says:
“When we own portions of outstanding businesses with outstanding managements, our favorite holding period is forever.”
– Warren Buffett
Thanks for reading this article. Please send any feedback, corrections, or questions to [email protected].
