

Article updated on July 1st, 2022 by Bob Ciura
Spreadsheet data updated daily
The Dividend Aristocrats are a select group of 65 S&P 500 stocks with 25+ years of consecutive dividend increases.
They are the ‘best of the best’ dividend growth stocks. The Dividend Aristocrats have a long history of outperforming the market.
The requirements to be a Dividend Aristocrat are:
- Be in the S&P 500
- Have 25+ consecutive years of dividend increases
- Meet certain minimum size & liquidity requirements
There are currently 65 Dividend Aristocrats. You can download an Excel spreadsheet of all 65 (with metrics that matter such as dividend yields and price-to-earnings ratios) by clicking the link below:
Note: On January 24th, 2022 Brown & Brown (BRO) and Church & Dwight (CHD) were added to the Dividend Aristocrats Index, while AT&T (T) was removed. Also, People’s United (PBCT) was acquired, leaving 65 Dividend Aristocrats.
Source: S&P News Releases.
You can see detailed analysis on all 65 further below in this article, in our Dividend Aristocrats In Focus Series. Analysis includes valuation, growth, and competitive advantage(s).
Table of Contents
How to Use The Dividend Aristocrats List To Find Dividend Investment Ideas
The downloadable Dividend Aristocrats Excel Spreadsheet List above contains the following for each stock in the index:
- Price-to-earnings ratio
- Dividend yield
- Market capitalization
All Dividend Aristocrats are high-quality businesses based on their long dividend histories. A company cannot pay rising dividends for 25+ years without having a strong and durable competitive advantage.
But not all Dividend Aristocrats make equally good investments today. That’s where the spreadsheet in this article comes into play. You can use the Dividend Aristocrats spreadsheet to quickly find quality dividend investment ideas.
The list of all 65 Dividend Aristocrats is valuable because it gives you a concise list of all S&P 500 stocks with 25+ consecutive years of dividend increases (that also meet certain minimum size and liquidity requirements).
These are businesses that have both the desire and ability to pay shareholders rising dividends year-after-year. This is a rare combination.
Together, these two criteria are powerful – but they are not enough. Value must be considered as well.
The spreadsheet above allows you to sort by trailing price-to-earnings ratio so you can quickly find undervalued, high-quality dividend stocks.
Here’s how to use the Dividend Aristocrats list to quickly find high-quality dividend growth stocks potentially trading at a discount:
- Download the list
- Sort by ‘Trailing PE Ratio,’ smallest to largest
- Research the top stocks further
Here’s how to do this quickly in the spreadsheet:
Step 1: Download the list, and open it.
Step 2: Apply a filter function to each column in the spreadsheet.
Step 3: Click on the small gray down arrow next to ‘Trailing P/E Ratio’, and then sort smallest to largest.
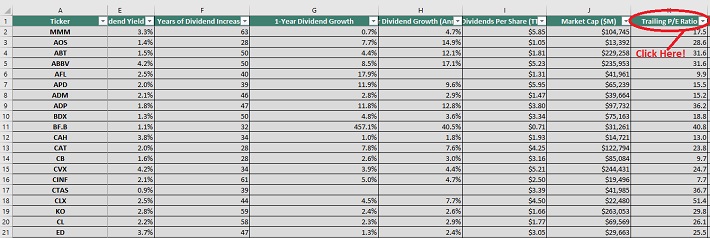
Step 4: Review the highest ranked Dividend Aristocrats before investing. You can see detailed analysis on every Dividend Aristocrat found below in this article.
That’s it; you can follow the same procedure to sort by any other metric in the spreadsheet.
This article examines the characteristics and performance of the Dividend Aristocrats in detail. Click here for a table of contents for easy navigation of this article.
Performance Through June 2022
In June 2022, the Dividend Aristocrats, as measured by the Dividend Aristocrats ETF (NOBL), registered a negative 6.7% return. It outperformed the SPDR S&P 500 ETF (SPY) for the month.
- NOBL generated total returns of -6.7% in June 2022
- SPY generated total returns of -8.2% in June 2022
Short-term performance is mostly noise. Performance should be measured over a minimum of 3 years, and preferably longer periods of time.
The Dividend Aristocrats Index has nearly matched the performance of the broader market index over the last decade, with a 12.95% total annual return for the Dividend Aristocrats versus 12.96% for the S&P 500 Index.
The Dividend Aristocrats have exhibited lower risk than the benchmark, as measured by standard deviation.
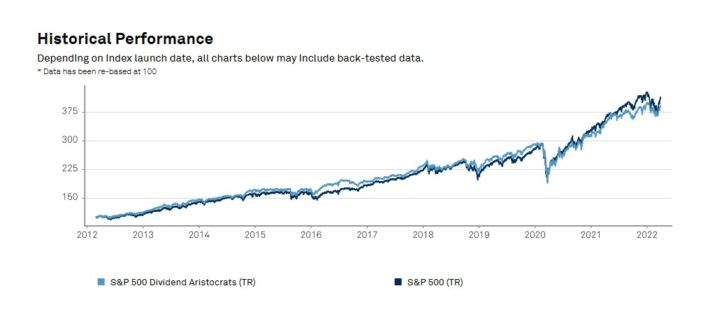
Source: S&P Fact Sheet
Higher total returns with lower volatility is the ‘holy grail’ of investing. It is worth exploring the characteristics of the Dividend Aristocrats in detail to determine why they have performed so well.
Note that a good portion of the outperformance relative to the S&P 500 comes during recessions (2000 – 2002, 2008). Dividend Aristocrats have historically seen smaller drawdowns during recessions versus the S&P 500. This makes holding through recessions that much easier. Case-in-point: In 2008 the Dividend Aristocrats Index declined 22%. That same year, the S&P 500 declined 38%.
Great businesses with strong competitive advantages tend to be able to generate stronger cash flows during recessions. This allows them to gain market share while weaker businesses fight to stay alive.
The Dividend Aristocrats Index has beaten the market over the last 28 years…
We believe dividend paying stocks outperform non-dividend paying stocks for three reasons:
- A company that pays dividends is likely to be generating earnings or cash flows so that it can pay dividends to shareholders. This excludes ‘pre-earnings’ start-ups and failing businesses. In short, it excludes the riskiest stocks.
- A business that pays consistent dividends must be more selective with the growth projects it takes on because a portion of its cash flows are being paid out as dividends. Scrutinizing over capital allocation decisions likely adds to shareholder value.
- Stocks that pay dividends are willing to reward shareholders with cash payments. This is a sign that management is shareholder friendly.
In our view, Dividend Aristocrats have historically outperformed the market and other dividend paying stocks because they are, on average, higher-quality businesses.
A high-quality business should outperform a mediocre business over a long period of time, all other things being equal.
For a business to increase its dividends for 25+ consecutive years, it must have or at least had in the very recent past a strong competitive advantage.
Sector Overview
A sector breakdown of the Dividend Aristocrats Index is shown below:
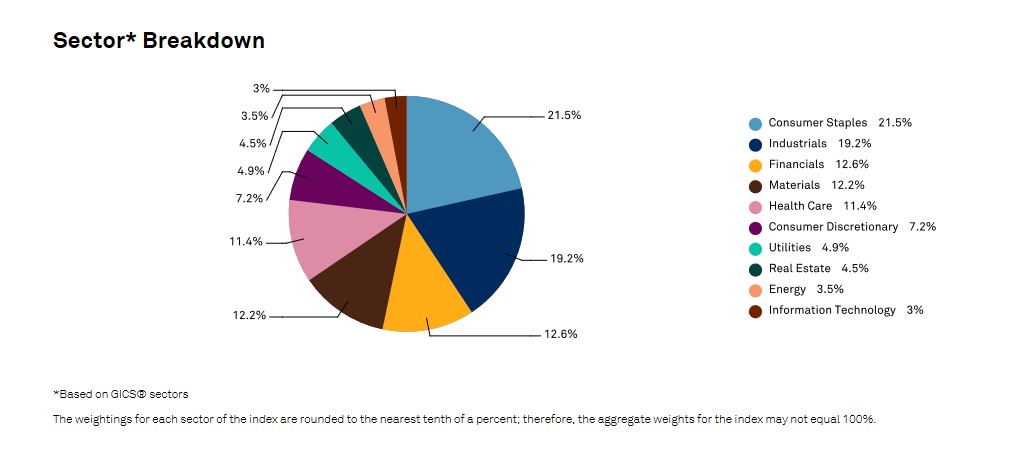
The top 2 sectors by weight in the Dividend Aristocrats are Industrials and Consumer Staples. The Dividend Aristocrats Index is tilted toward Consumer Staples and Industrials relative to the S&P 500.
These 2 sectors make up over 40% of the Dividend Aristocrats Index, but less than 20% of the S&P 500.
The Dividend Aristocrats Index is also significantly underweight the Information Technology sector, with a 3% allocation compared with over 20% allocation within the S&P 500.
The Dividend Aristocrat Index is filled with stable ‘old economy’ blue chip consumer products businesses and manufacturers; the 3M’s (MMM), Coca-Cola’s (KO), and Johnson & Johnson’s (JNJ) of the investing world.
These ‘boring’ businesses aren’t likely to generate 20%+ earnings-per-share growth, but they also are very unlikely to see large earnings drawdowns as well.
The Top 7 Dividend Aristocrats Now
Analysis on our top 7 Dividend Aristocrats is below. These rankings are based on 5 year forward expected total return estimates from the Sure Analysis Research Database.
Looking to go beyond the Dividend Aristocrats?
There are ~140 securities with 25+ years of rising dividends, more than double the number of Dividend Aristocrats. That’s because the Dividend Aristocrats list excludes securities that aren’t in the S&P 500 and/or that don’t meet certain size and liquidity requirements.
Each month we rank stocks with 25+ years of rising dividends based on a mix of expected total returns and Dividend Risk Scores in our Top 10 Dividend Elite Service.
A special report of our top 10 is published on the 1st Sunday of each month.
Click here to start your free trial of this service and get your special report on our top 10 dividend stock picks with 25+ years of rising dividends.
Dividend Aristocrat #7: Walgreens Boots Alliance (WBA)
- 5-year Expected Annual Returns: 14.2%
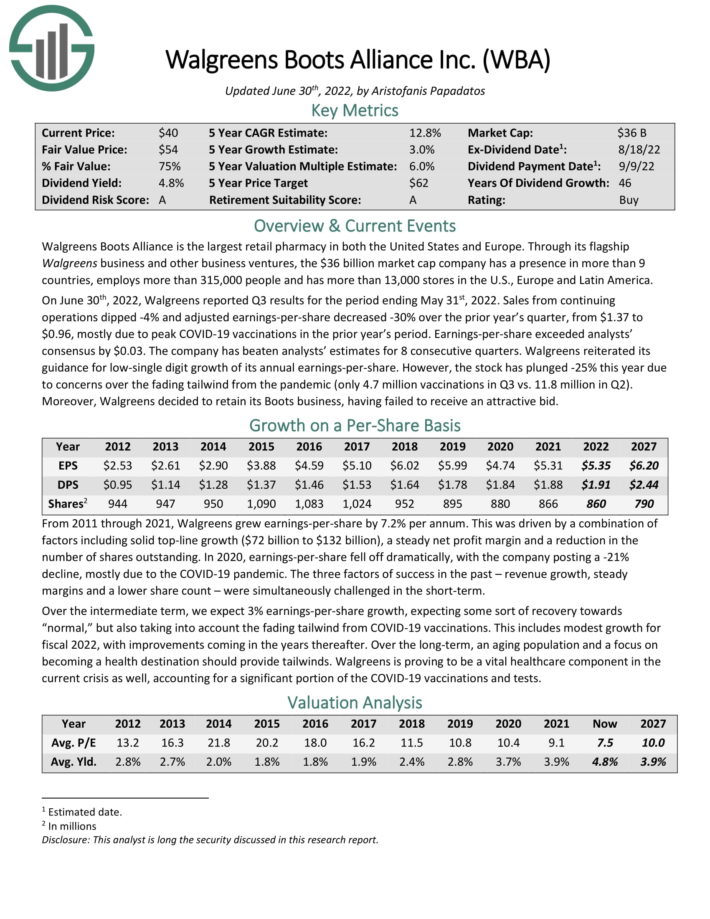
Walgreens Boots Alliance is the largest retail pharmacy in both the United States and Europe. Through its flagship Walgreens business and other business ventures, the company employs more than 325,000 people and has more than 13,000 stores.
On June 30th, 2022, Walgreens reported Q3 results for the period ending May 31st, 2022. Sales from continuing operations dipped -4% and adjusted earnings-per-share decreased -30% over the prior year’s quarter, from $1.37 to $0.96, mostly due to peak COVID-19 vaccinations in the prior year’s period. Earnings-per-share exceeded analysts’ consensus by $0.03. The company has beaten analysts’ estimates for 8 consecutive quarters.
Walgreens reiterated its guidance for low-single digit growth of its annual earnings-per-share.
We expect 5% annual EPS growth over the next five years. In addition, the stock has a 5.0% dividend yield. We also view the stock as undervalued, leading to total expected returns of 14.2% per year.
Click here to download our most recent Sure Analysis report on Walgreens (preview of page 1 of 3 shown below):
Dividend Aristocrat #6: Pentair (PNR)
- 5-year Expected Annual Returns: 14.6%
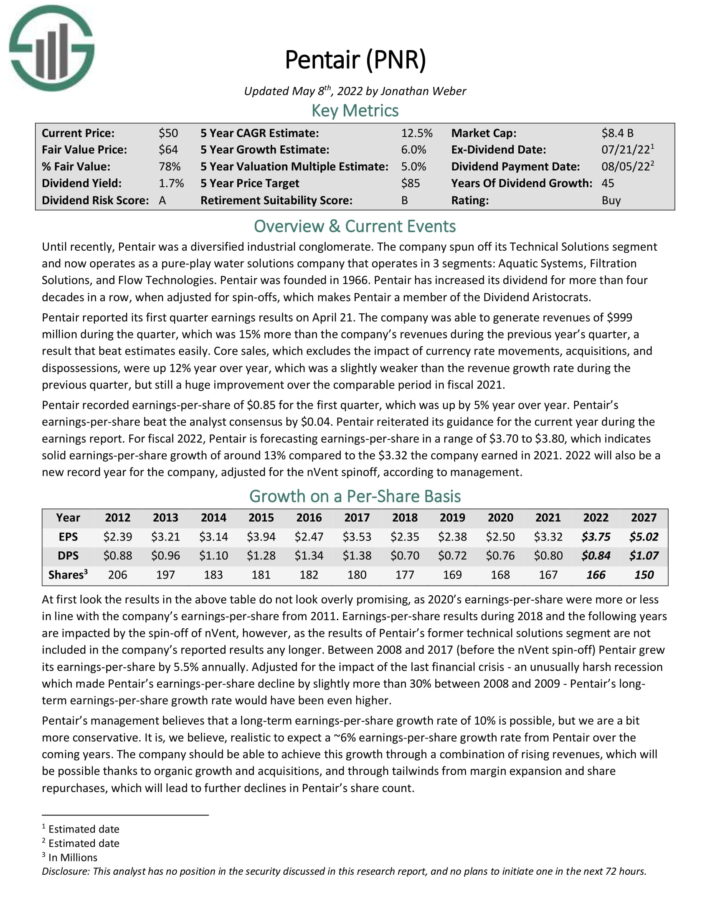
Pentair operates as a pure–play water solutions company with 3 segments: Aquatic Systems, Filtration Solutions, and Flow Technologies. Pentair was founded in 1966. Pentair has increased its dividend for more than four decades in a row, when adjusted for spin–offs.
Pentair reported its first-quarter earnings results on April 21. Revenues of $999 million rose 15% year-over-year, and beat estimates easily. Core sales, which excludes the impact of currency rate movements, acquisitions, and dispossessions, were up 12% year over year.
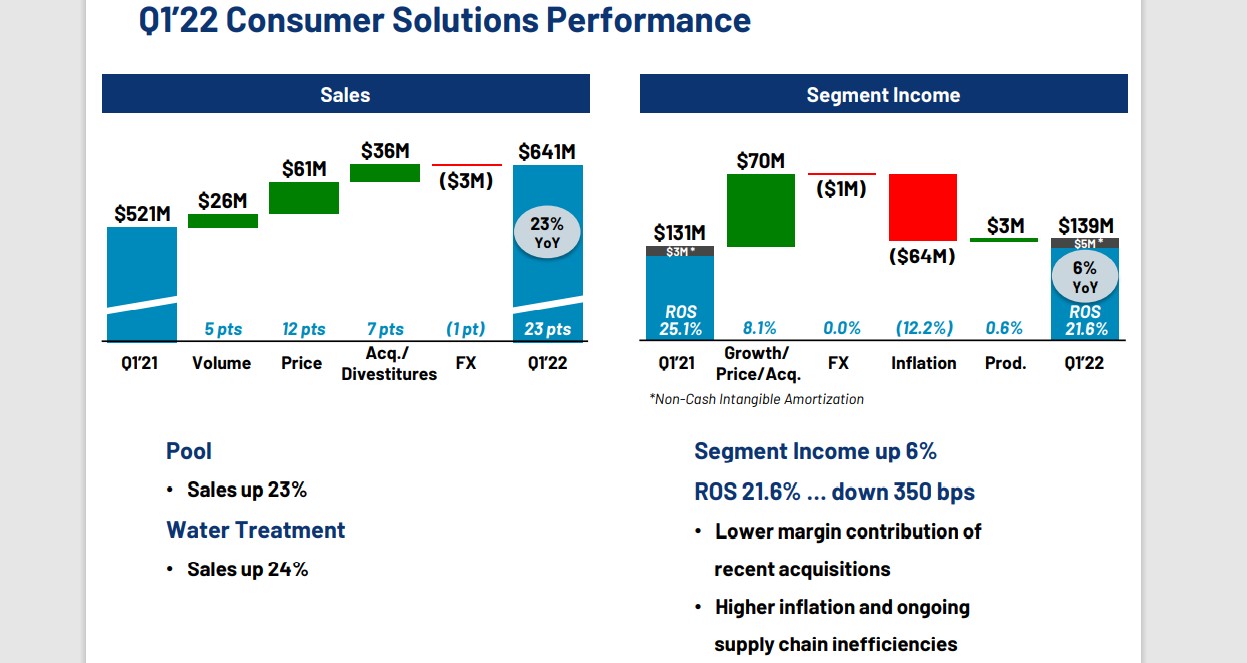
Source: Investor Presentation
Pentair recorded earnings-per-share of $0.85 for the first quarter, which was up by 5% year over year. Pentair’s earnings-per-share beat the analyst consensus by $0.04.
Pentair reiterated its guidance for the current year during the earnings report. For fiscal 2022, Pentair is forecasting earnings-per-share in a range of $3.70 to $3.80, which indicates solid earnings-per-share growth of around 13% compared to the $3.32 the company earned in 2021. 2022 will also be a new record year for the company, adjusted for the nVent spinoff, according to management.
Total returns are expected to reach 14.6% over the next five years.
Click here to download our most recent Sure Analysis report on Pentair (preview of page 1 of 3 shown below):
Dividend Aristocrat #5: Target Corporation (TGT)
- 5-year Expected Annual Returns: 15.3%
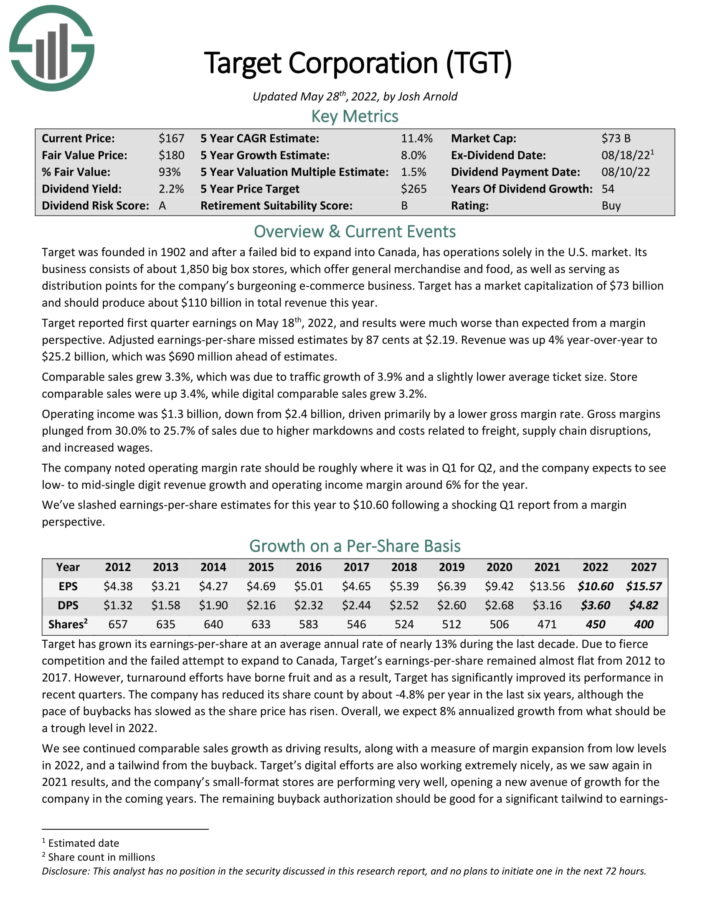
Target was founded in 1902 and after a failed bid to expand into Canada, has operations solely in the U.S. market. Its business consists of about 1,850 big box stores, which offer general merchandise and food, as well as serving as distribution points for the company’s burgeoning e-commerce business.
Target reported first-quarter results on May 18th. Quarterly revenue of $25.17 billion beat analyst estimates by $688 million, but earnings-per-share of $2.19 missed estimates by $0.87. Cost inflation led to the disappointing EPS figure.
We see continued comparable sales growth as driving results, along with a small measure of margin expansion, and a tailwind from the buyback. Target’s digital efforts are also working extremely nicely, and the company’s small-format stores are performing very well, opening a new avenue of growth for the company in the coming years. The remaining buyback authorization should be good for a significant tailwind to earnings-per-share in the coming years.
We expect 8% annual EPS growth through 2027. In addition, the stock has a current dividend yield of 3.1%. Lastly, the stock has a 2022 P/E of 13.3, below our fair value P/E of 17. Total returns are estimated at 15.3% per year over the next five years.
Click here to download our most recent Sure Analysis report on Target (preview of page 1 of 3 shown below):
Dividend Aristocrat #4: Lowe’s Companies (LOW)
- 5-year Expected Annual Returns: 16.2%
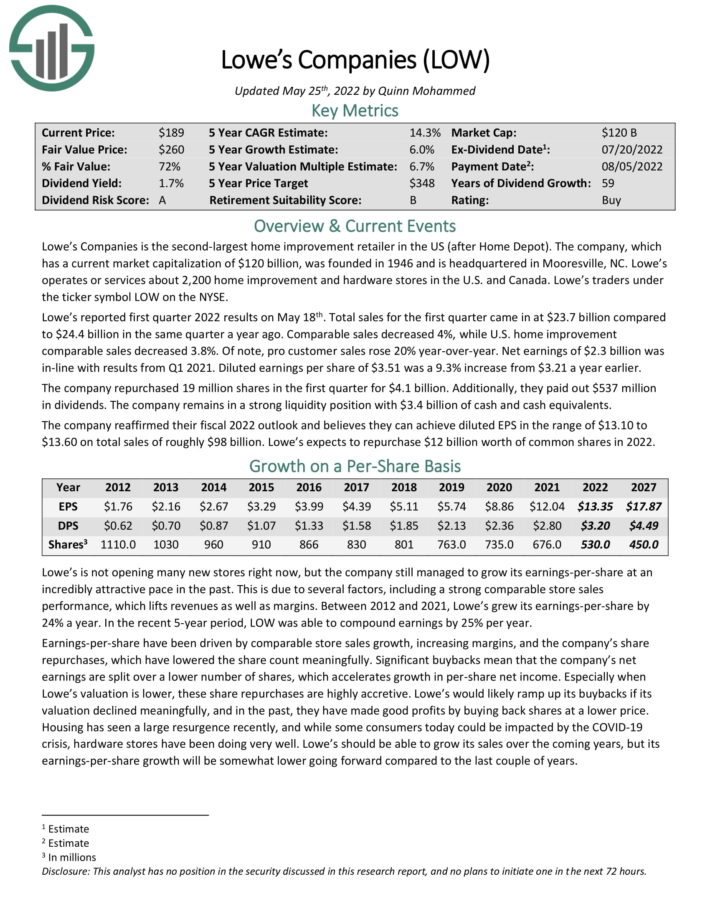
Lowe’s Companies is the second-largest home improvement retailer in the US (after Home Depot). Lowe’s operates or services more than 2,200 home improvement and hardware stores in the U.S. and Canada.
Lowe’s reported first quarter 2022 results on May 18th. Total sales for the first quarter came in at $23.7 billion compared to $24.4 billion in the same quarter a year ago. Comparable sales decreased 4%, while U.S. home improvement comparable sales decreased 3.8%.
Of note, pro customer sales rose 20% year-over-year. Net earnings of $2.3 billion was in-line with results from Q1 2021. Diluted earnings per share of $3.51 was a 9.3% increase from $3.21 a year earlier.
The company repurchased 19 million shares in the first quarter for $4.1 billion. Additionally, they paid out $537 million in dividends. The company remains in a strong liquidity position with $3.4 billion of cash and cash equivalents.
The company provided a fiscal 2022 outlook and believes they can achieve diluted EPS in the range of $13.10 to $13.60 on total sales of roughly $98 billion. Lowe’s expects to repurchase $12 billion worth of common shares in 2022.
The combination of multiple expansion, 6% expected EPS growth and the 2.4% dividend yield lead to total expected returns of 16.2% per year.
Click here to download our most recent Sure Analysis report on Lowe’s (preview of page 1 of 3 shown below):
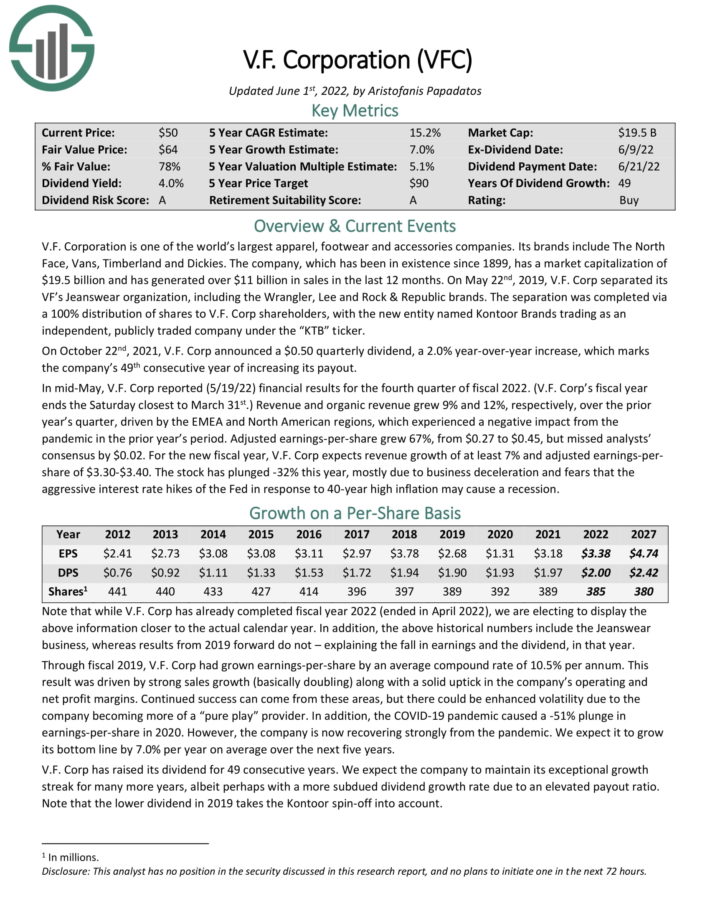
Dividend Aristocrat #3: V.F. Corporation (VFC)
- 5-year Expected Annual Returns: 18.0%
V.F. Corporation is one of the world’s largest apparel, footwear and accessories companies. The company’s brands include The North Face, Vans, Timberland and Dickies. The company, which has been in existence since 1899, generated over $11 billion in sales in the last 12 months.
In mid-May, V.F. Corp reported (5/19/22) financial results for the fourth quarter of fiscal 2022. Revenue and organic revenue grew 9% and 12%, respectively, over the prior year’s quarter, driven by the EMEA and North American regions, which experienced a negative impact from the pandemic in the prior year’s period.
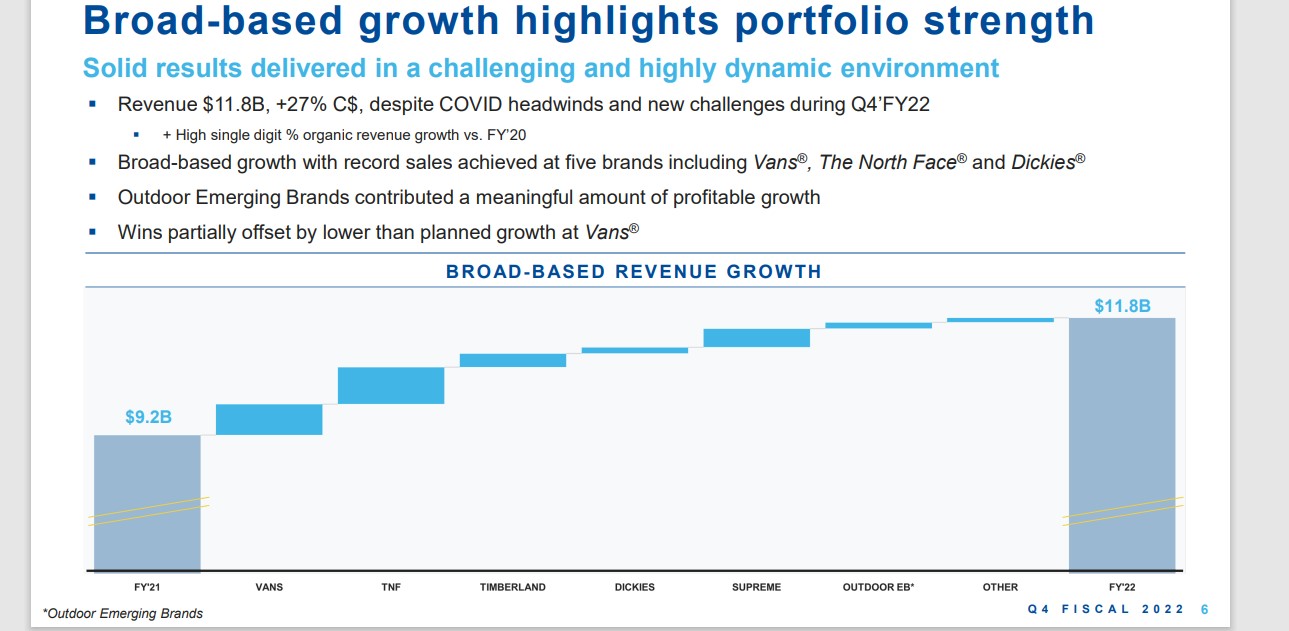
Source: Investor Presentation
Adjusted earnings-per-share grew 67%, from $0.27 to $0.45, but missed analysts’ consensus by $0.02. For the new fiscal year, V.F. Corp expects revenue growth of at least 7% and adjusted earnings-per-share of $3.30 to $3.40.
We expect 7% annual EPS growth over the next five years. VFC stock also has a dividend yield of 4.5%. Annual returns from an expanding P/E multiple are estimated at 6.5%, equaling total expected annual returns of 18.0% through 2027.
Click here to download our most recent Sure Analysis report on V.F. Corp. (preview of page 1 of 3 shown below):
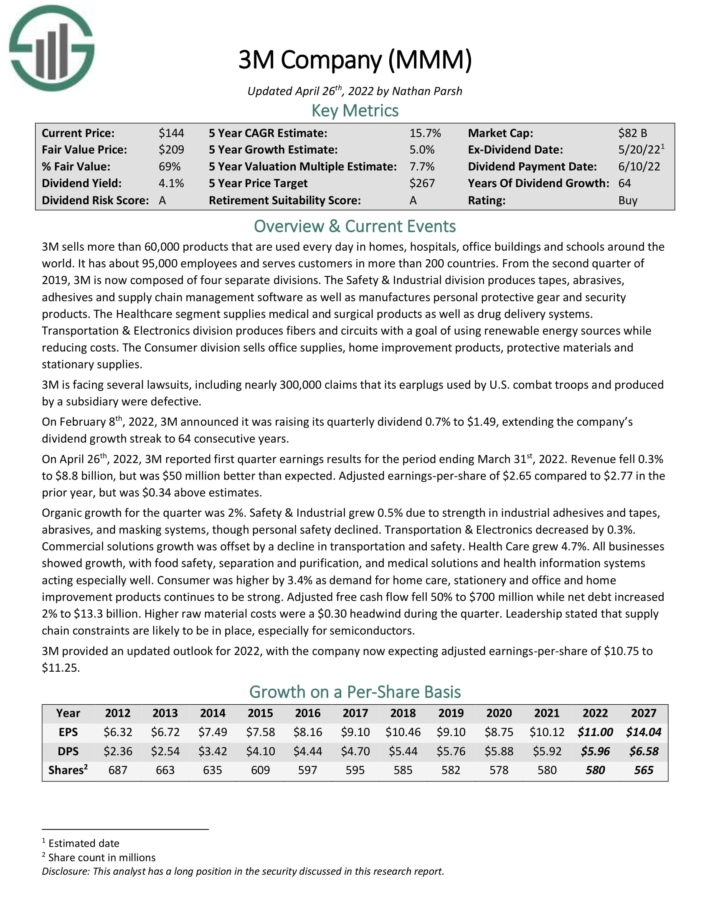
Dividend Aristocrat #2: 3M Company (MMM)
- 5-year Expected Annual Returns: 18.2%
3M sells more than 60,000 products that are used every day in homes, hospitals, office buildings and schools around the world. It has about 95,000 employees and serves customers in more than 200 countries.
3M is now composed of four separate divisions. The Safety & Industrial division produces tapes, abrasives, adhesives and supply chain management software as well as manufactures personal protective gear and security products.
The Healthcare segment supplies medical and surgical products as well as drug delivery systems. Transportation & Electronics division produces fibers and circuits with a goal of using renewable energy sources while reducing costs. The Consumer division sells office supplies, home improvement products, protective materials and stationary supplies.
On April 26th, 2022, 3M reported first quarter earnings results for the period ending March 31st, 2022. Revenue fell 0.3% to $8.8 billion, but was $50 million better than expected. Adjusted earnings-per-share of $2.65 compared to $2.77 in the prior year, but was $0.34 above estimates. Organic growth for the quarter was 2%.
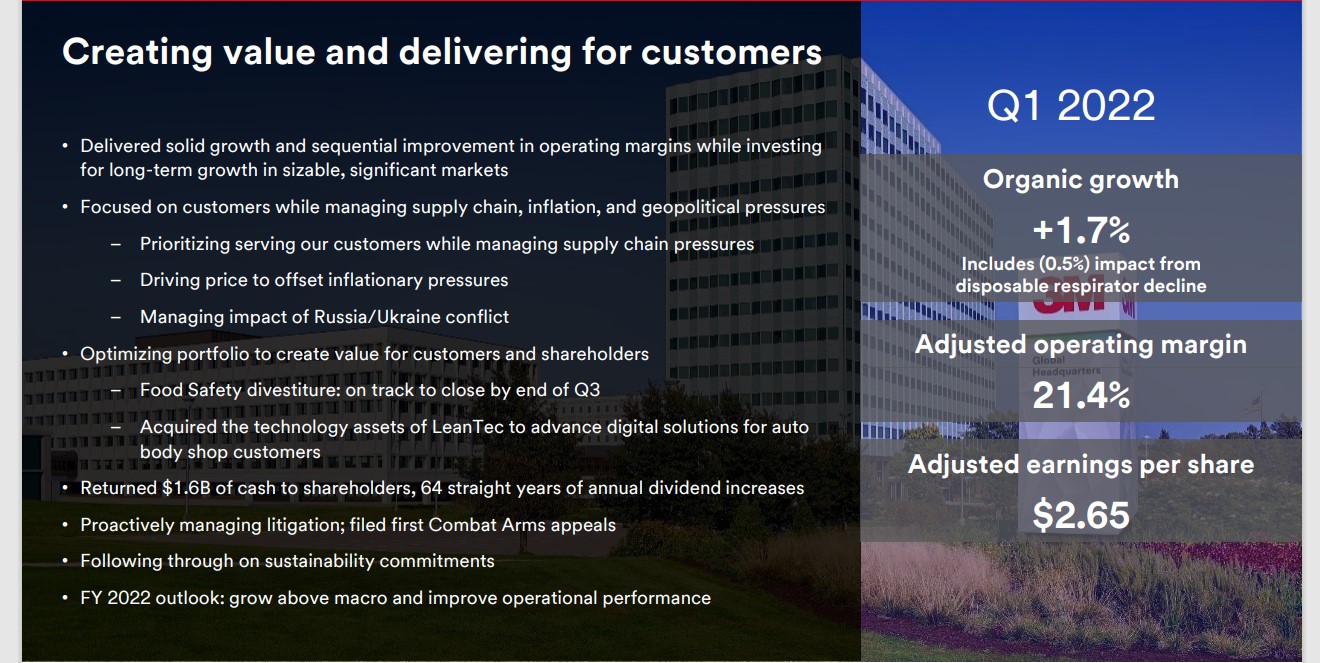
Source: Investor Presentation
Safety & Industrial grew 0.5% due to strength in industrial adhesives and tapes, abrasives, and masking systems, though personal safety declined. Transportation & Electronics decreased by 0.3%. Commercial solutions growth was offset by a decline in transportation and safety. Health Care grew 4.7%. Consumer was higher by 3.4% as demand for home care, stationery and office and home improvement products continues to be strong.
3M provided an updated outlook for 2022, with the company now expecting adjusted earnings-per-share of $10.75 to $11.25. Total returns are expected to reach 18.2% per year over the next five years.
Click here to download our most recent Sure Analysis report on 3M (preview of page 1 of 3 shown below):
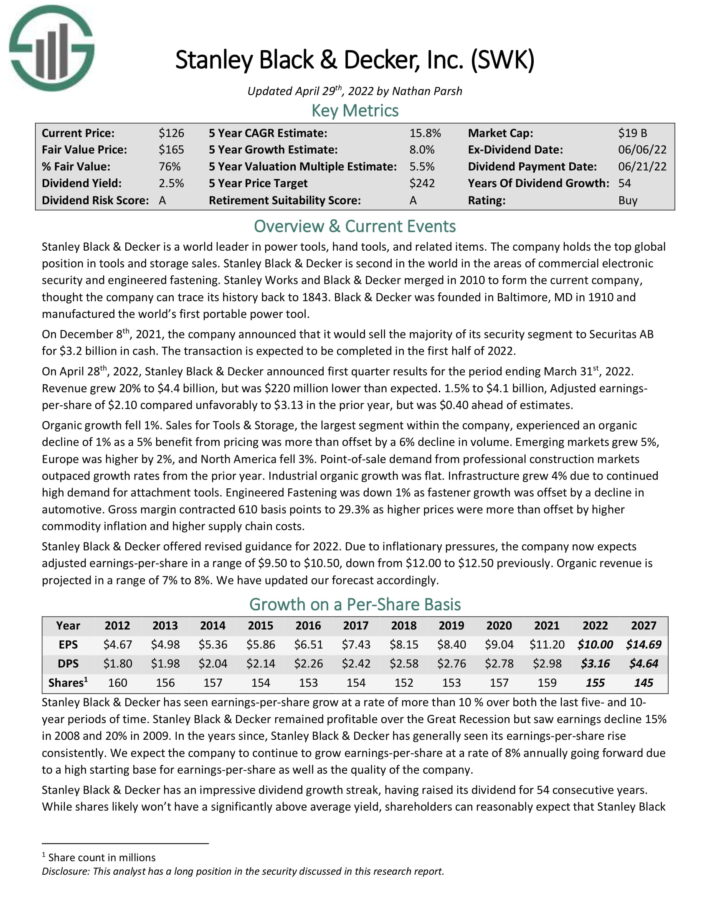
Dividend Aristocrat #1: Stanley Black & Decker (SWK)
- 5-year Expected Annual Returns: 20.1%
Stanley Black & Decker is a world leader in power tools, hand tools, and related items. The company holds the top global position in tools and storage sales. Stanley Black & Decker is second in the world in the areas of commercial electronic security and engineered fastening.
You can see an overview of the company’s 2022 first-quarter performance in the image below:
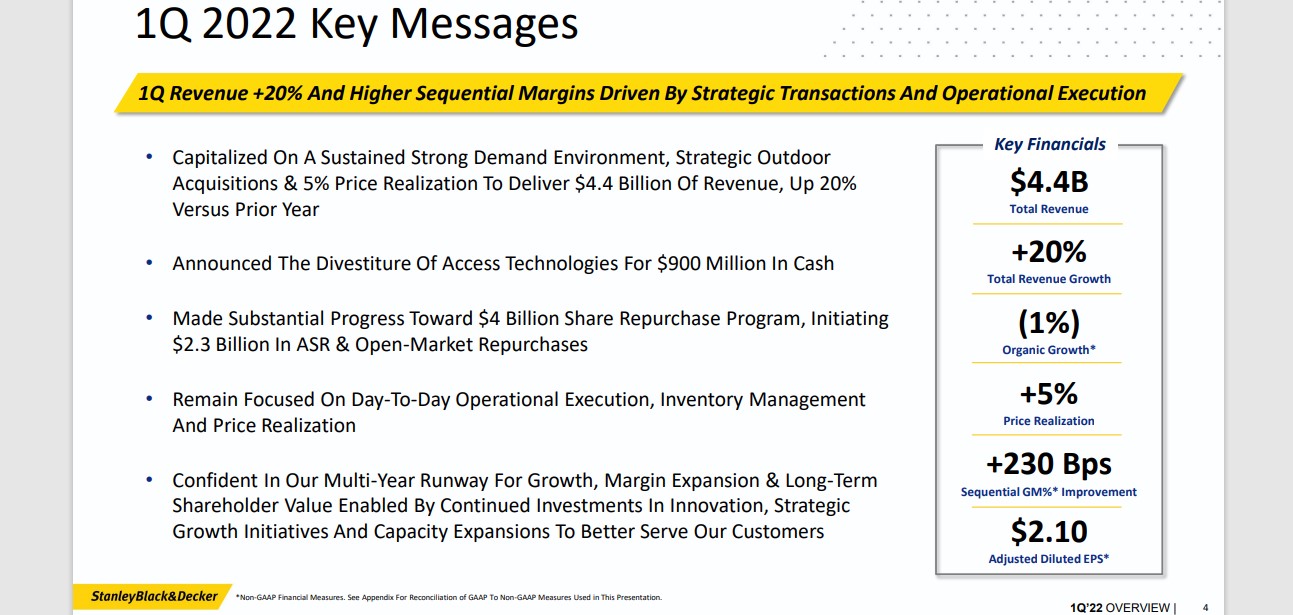
Source: Investor Presentation
Revenue grew 20% to $4.4 billion, but was $220 million lower than expected. Adjusted earnings-per-share of $2.10 compared unfavorably to $3.13 in the prior year, but was $0.40 ahead of estimates. Organic growth fell 1%.
Stanley Black & Decker offered revised guidance for 2022. Due to inflationary pressures, the company now expects adjusted earnings-per-share in a range of $9.50 to $10.50, down from $12.00 to $12.50 previously. Organic revenue is projected in a range of 7% to 8%.
The stock has a 3.0% dividend yield, and we expect 8% annual EPS growth. With a ~9.1% annual boost from an expanding P/E multiple, total returns are expected to reach 20.1% per year.
Click here to download our most recent Sure Analysis report on SWK (preview of page 1 of 3 shown below):
The Dividend Aristocrats In Focus Analysis Series
You can see analysis on every single Dividend Aristocrat below. Each is sorted by GICS sectors and listed in alphabetical order by name. The newest Sure Analysis Research Database report for each security is included as well.
Consumer Staples
Industrials
Health Care
Consumer Discretionary
Financials
Materials
Energy
Information Technology
Real Estate
Utilities
Looking for no-fee DRIP Dividend Aristocrats? Click here to read an article examining all 15 no-fee DRIP Dividend Aristocrats in detail.
Historical Dividend Aristocrats List
(1989 – 2022)
The image below shows the history of the Dividend Aristocrats Index from 1989 through 2022:
Note: CL, GPC, and NUE were all removed and re-added to the Dividend Aristocrats Index through the historical period analyzed above. We are unsure as to why. Companies created via a spin-off (like AbbVie) can be Dividend Aristocrats with less than 25 years of rising dividends if the parent company was a Dividend Aristocrat.

This information was compiled from the following sources:
Frequently Asked Questions
This section will address some of most common questions investors have regarding the Dividend Aristocrats.
1. What is the highest-paying Dividend Aristocrat?
Answer: Leggett & Platt currently yields 5.1%.
2. What is the difference between the Dividend Aristocrats and the Dividend Kings?
Answer: The Dividend Aristocrats must be constituents of the S&P 500 Index, have raised their dividends for at least 25 consecutive years, and satisfy a number of liquidity requirements. The Dividend Kings only need to have raised their dividends for at least 50 consecutive years.
3. Is there an ETF that tracks the Dividend Aristocrats?
Answer: Yes, the Dividend Aristocrats ETF (NOBL) is an exchange-traded fund that specifically holds the Dividend Aristocrats. For a more detailed analysis of dividend ETFs, click here.
4. What is the difference between the Dividend Aristocrats and the Dividend Champions?
Answer: The Dividend Aristocrats and Dividend Champions share one requirement, which is that a company must have raised its dividend for at least 25 consecutive years.
But like the Dividend Kings, the Dividend Champions do not need to be in the S&P 500 Index, nor satisfy the various liquidity requirements.
5. Which Dividend Aristocrat has the longest active streak of annual dividend increases?
Currently, there are 3 Dividend Aristocrats tied at 66 years: Genuine Parts, 3M Company, and Dover Corporation.
6. What is the average dividend yield of the Dividend Aristocrats?
Right now, the average dividend yield of the 65 Dividend Aristocrats is 2.6%.
7. Are the Dividend Aristocrats safe investments?
While there are never any guarantees when it comes to the stock market, we believe the Dividend Aristocrats are among the safest dividend stocks when it comes to the sustainability of their dividend payouts.
The Dividend Aristocrats have durable competitive advantages that allow them to raise their dividends each year, even during a recession.
Other Dividend Lists & Final Thoughts
The Dividend Aristocrats list is not the only way to quickly screen for stocks that regularly pay rising dividends.
There is nothing magical about the Dividend Aristocrats. They are ‘just’ a collection of high-quality shareholder friendly stocks that have strong competitive advantages.
Purchasing these types of stocks at fair or better prices and holding for the long-run will likely result in favorable long-term performance.
You have a choice in what type of business you buy into. You can buy into the mediocre, or the excellent.
Often, excellent businesses are not more expensive (based on their price-to-earnings ratio) than mediocre businesses.
“When we own portions of outstanding businesses with outstanding managements, our favorite holding period is forever.”
– Warren Buffett
Disclaimer: Sure Dividend is not affiliated with S&P Global in any way. S&P Global owns and maintains The Dividend Aristocrats Index. The information in this article and downloadable spreadsheet is based on Sure Dividend’s own review, summary, and analysis of the S&P 500 Dividend Aristocrats ETF (NOBL) and other sources, and is meant to help individual investors better understand this ETF and the index upon which it is based. None of the information in this article or spreadsheet is official data from S&P Global. Consult S&P Global for official information.
Thanks for reading this article. Please send any feedback, corrections, or questions to [email protected].
