

Join Our Telegram channel to stay up to date on breaking news coverage
The 1Inch price prediction shows that 1INCH is facing the upside as the coin moves to break above the upper boundary of the channel.
1Inch Prediction Statistics Data:
- 1Inch price now – $0.61
- 1Inch market cap – $360.7 million
- 1Inch circulating supply – 583.8 million
- 1Inch total supply – 1.5 billion
- 1Inch Coinmarketcap ranking – #94
1INCH/USD Market
Key Levels:
Resistance levels: $0.75, $0.80, $0.85
Support levels: $0.50, $0.45, $0.40
Buy 1Inch Now
Your capital is at risk
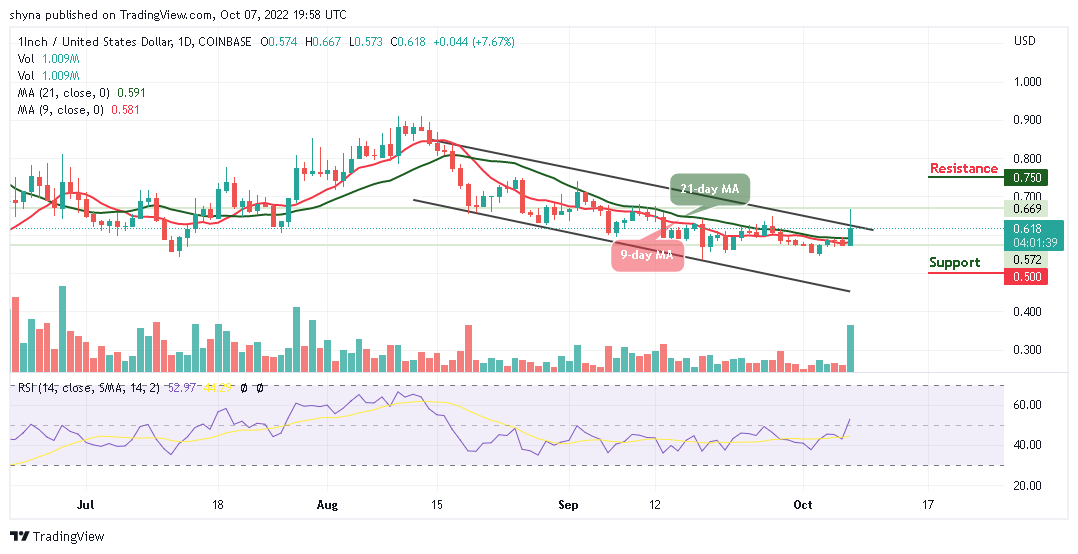
1INCH/USD is moving to cross above the upper boundary of the channel to continue the bullish movement. According to the daily chart, the 1Inch price is likely to shoot to the upside while the technical indicator Relative Strength Index (14) crosses above the 50-level. Therefore, the market is projecting a volatile movement where 1Inch may continue to follow the bullish movement.

1Inch Price Prediction: 1Inch Price Aims at the Upside
As the daily chart reveals, the 1Inch price touches the daily high at $0.66 today so that the 1inch price can stay above the 9-day and 21-day moving averages. On the contrary, any bearish movement towards the lower boundary of the channel may bring the price to the support levels of $0.50, $0.45, and $0.40.
However, considering a continuous bullish movement for this coin, 1INCH/USD may spike above the upper boundary of the channel to hit the potential resistance levels of $0.75, $0.80, and 0.85 in the long-term bullish. Nevertheless, the technical indicator Relative Strength Index (14) is moving to cross above the 60-level, suggesting additional bullish movements for the market.
Against Bitcoin, the 1Inch price is seen trading above the 9-day and 21-day moving averages where the price is expected to break to the upside. However, should the price succeed, it may continue an upward trend which could touch the potential resistance level at 350 SAT and above.
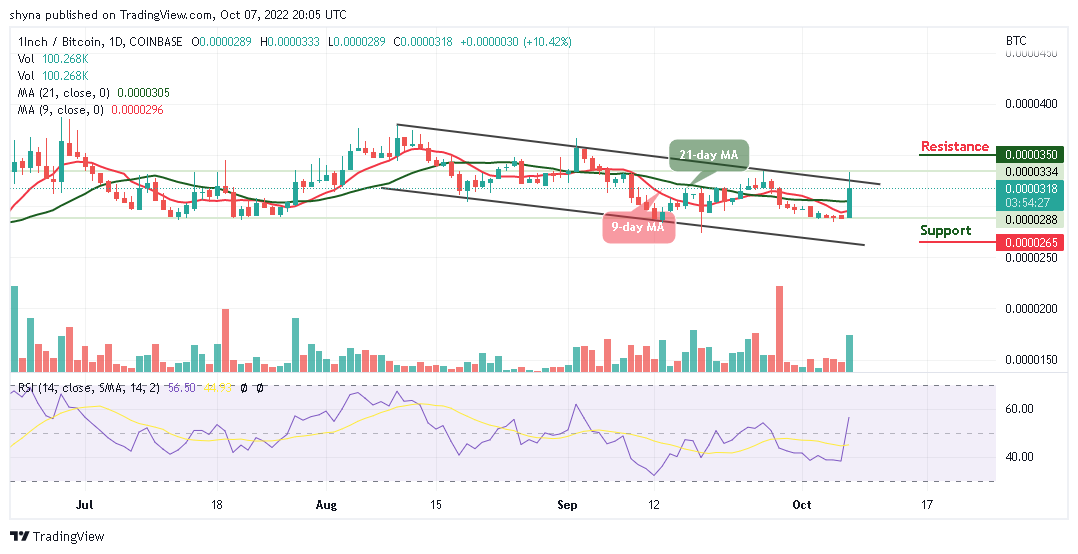
In other words, if the 1INCH price slides and faces the lower boundary of the channel, the coin is expected to locate the support at 265 SAT and below. Moreover, the technical indicator Relative Strength Index (14) moves toward the 60-level which reveals that the 1Inch price may continue to move to the upside.
Tamadoge – Play to Earn Meme Coin

- Earn TAMA in Battles With Doge Pets
- Maximum Supply of 2 Bn, Token Burn
- Now Listed on OKX, Bitmart, Uniswap
- Upcoming Listings on LBank, MEXC
Join Our Telegram channel to stay up to date on breaking news coverage
