

Crude Oil Technical Forecast: WTI Weekly Trade Levels
- Crude Oil updated technical trade levels – Weekly Chart
- WTI plunges to critical support pivot on seventh-weekly test – risk for inflection off 83.28-87.15
- New to Oil Trading? Get started with this Free How to Trade Oil- Beginners Guide
Recommended by Michael Boutros
Understanding the Core Fundamentals of Oil Trading
Crude oil prices plunged nearly 17% off the August highs with WTI attempting to mark a third consecutive weekly decline on Friday. Despite the losses, price has continued to hold above / within a critical support zone and our focus has been on a pivot off this key threshold in the days ahead. This remains a BIG moment for crude. These are the updated targets and invalidation levels that matter on the oil price weekly technical chart. Review my latest Strategy Webinar for an in-depth breakdown of this crude oil price technical setup and more.
Starts in:
Live now:
Sep 19
( 12:09 GMT )
Recommended by Michael Boutros
Weekly Scalping Webinar
Crude Oil Price Chart – WTI Weekly
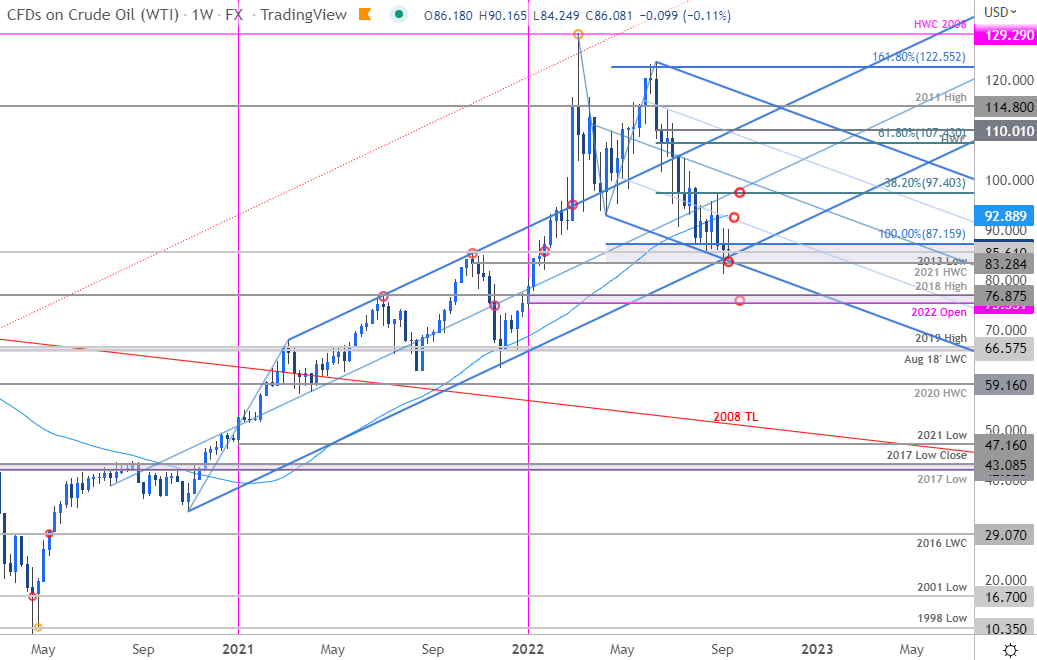
Chart Prepared by Michael Boutros, Technical Strategist; Crude Oil (WTI) on Tradingview
Notes: In my last Oil Price Weekly Technical Forecast we noted that WTI was, “back at a critical support zone into the start of the month at a major inflection zone. The focus remains on a reaction off this key threshold into September- watch the weekly close.” The zone in focus was 85.61-88.01 and price has been unable to close below this threshold for the past seven-weeks. . . A closer review of price action has us re-amending that key zone into 83.28-87.15 – a region defined by the 2021 high-week reversal close, the 2013 low and the 100% extension of the yearly decline. The technical significance of this confluent pivot zone cannot be understated and a close below could fuel another accelerated bout of losses. That said, the immediate downside remains vulnerable while within / above this key range.
A break lower exposes the first major support objective at the 2022 yearly open / 2018 high at 75.35-76.87 backed by the August 2018 low-week close/ 2019 high at 65.92-66.57– both regions of interest for possible near-term exhaustion IF reached. Weekly resistance stands with the 52-week moving average / 25% parallel (currently ~92.88) with broader bearish invalidation now lowered to the 38.2% Fibonacci retracement of the June decline at 94.40.
Recommended by Michael Boutros
Get Your Free Oil Forecast
Bottom line: Oil prices have been testing a critical support pivot for over a month and the focus remains on possible inflection into this zone. From a trading standpoint, rallies should be limited by the 52-week moving average IF price is heading lower on this stretch with a close below needed to fuel the next leg lower in WTI. We continue to tread lightly here- this is a big level and a significant resolution in price may be just ahead. I’ll publish an updated Crude Oil Price Short-term Technical Outlook once we get further clarity on the near-term WTI trade levels.
For a complete breakdown of Michael’s trading strategy, review his Foundations of Technical Analysis series on Building a Trading Strategy
Crude Oil Trader Sentiment – WTI Price Chart
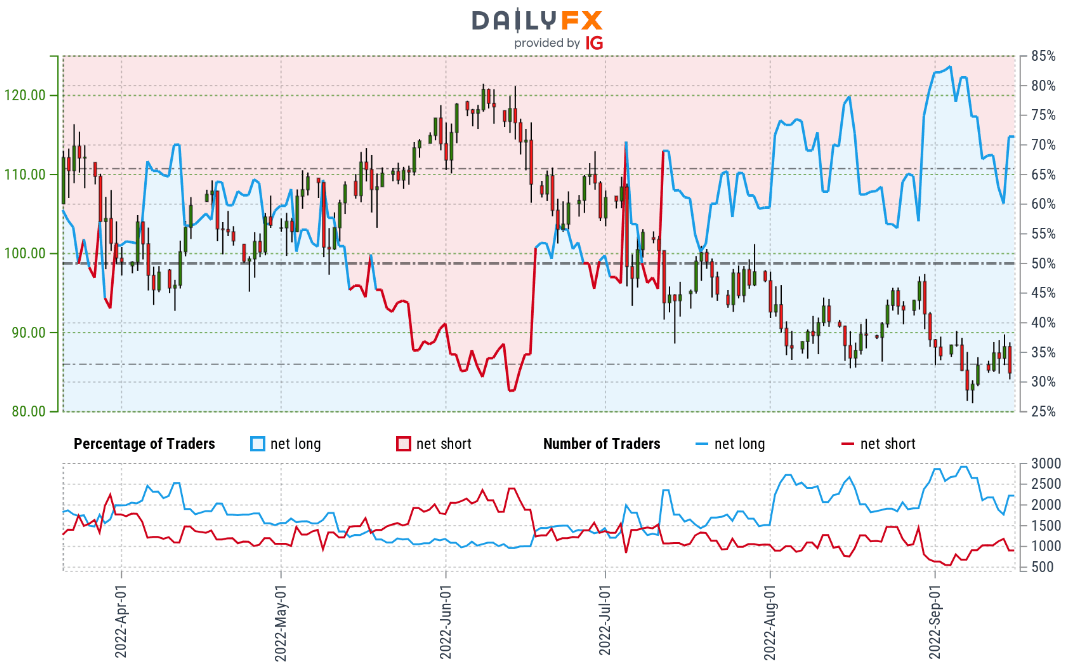
- A summary of IG Client Sentiment shows traders are net-long crude oil – the ratio stands at +2.10 (67.74% of traders are long) – typically bearish reading
- Long positions are 16.83% higher than yesterday and 13.73% lower from last week
- Short positions are 10.52% lower than yesterday and 4.43% higher from last week
- We typically take a contrarian view to crowd sentiment, and the fact traders are net-long suggests Oil – US Crude prices may continue to fall. Traders are more net-long than yesterday but less net-long from last week. The combination of current positioning and recent changes gives us a further mixed WTI trading bias from a sentiment standpoint.
| Change in | Longs | Shorts | OI |
| Daily | -8% | 4% | -5% |
| Weekly | -10% | -14% | -11% |
—
Active Weekly Technical Charts
{{GUIDE|BUILDING_CONFIDENCE_IN_TRADING|Learn how to Trade with Confidence – Free Trading Guide}}
— Written by Michael Boutros, Technical Strategist with DailyFX
Follow Michael on Twitter @MBForex
