

Fundamental Forecast for the US Dollar: Neutral
- Widening interest rate differentials continue to favor US Dollar strength, particularly against the Euro and the Japanese Yen.
- Incoming US economic data is likely to paint a less rosy picture, however, as record high inflation saps confidence and diminishes spending power.
- According to the IG Client Sentiment Index, the US Dollar has a bullish bias heading into the last week of April.
US Dollar Week in Review
The US Dollar’s (via the DXY Index) strong run continued through the third week of April, adding another +0.62%. The DXY Index has been positive in 12 of the 16 weeks thus far in 2022, good for a +5.69% advance year-to-date. EUR/USD rates, which spent most of the first four days of the week in positive territory, ended up down by -0.11%. GBP/USD rates dropped by -1.71%, their worst weekly performance since June 2021. USD/JPY rates added +1.69%, their seventh consecutive weekly gain.
The narrative behind the US Dollar’s ascent has remained consistent for much of this year: the Federal Reserve is on the verge of a series of significant rate hikes – just look at some of the recent comments by FOMC members – while other major central banks are not. Widening interest rate differentials are propping up the US Dollar, plain and simple.
US Economic Calendar in Focus
After a relatively quiet week on the data side (although there were Fed speakers aplenty), the US economic calendar is supersaturated with data releases that should prove market moving. Gauges of US consumer spending, US consumer confidence, the US jobs market, the US housing market, and US inflation pressures are all due out in the coming days.
- On Monday, April 25, the March US Chicago Fed national activity index will be released at 12:30 GMT.
- On Tuesday, April 26, March US durable goods orders are due at 12:30 GMT, followed by the February US house price index at 13 GMT, then the April US consumer confidence index and March US home sales at 14 GMT.
- On Wednesday, April 27, weekly US mortgage applications figures will be published at 11 GMT. At 12:30 GMT, the March US goods trade balance and March US retail sales (ex-autos) will be released. March US pending home sales are due at 14 GMT.s
- On Thursday, April 28, weekly US jobless claims and the initial 1Q’22 US GDP report are due at 12:30 GMT.
- On Friday, April 29, at 12:30 GMT, March US personal income and spending figures will be released, as will the March US PCE price index (the Fed’s preferred gauge of inflation). The final April US Michigan consumer sentiment reading will be published at 14 GMT.
Atlanta Fed GDPNow 1Q’22 Growth Estimate (April 19, 2022) (Chart 1)
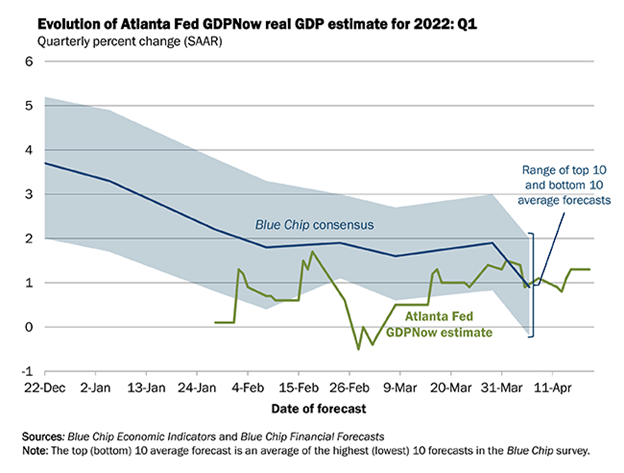
Based on the data received thus far about 1Q’22, the Atlanta Fed GDPNow growth forecast is now at +1.3% annualized, up from +1.1% on April 11. The upgrade was a result of “the nowcast of first-quarter real gross private domestic investment growth [increasing] from -0.8% to +0.1%.”
The next update to the 1Q’22 Atlanta Fed GDPNow growth forecast is due on Tuesday, April 26. The initial 1Q’22 US GDP report will be released on Thursday, April 28, at which point the Atlanta Fed GDPNow growth tracker will switch to 2Q’22.
For full US economic data forecasts, view the DailyFX economic calendar.
Several Rate Hikes Priced-In
With a new multi-decade high in US inflation rates, markets have dragged forward expectations for a rapid pace of rate hikes over the coming months. We can measure whether a Fed rate hike is being priced-in using Eurodollar contracts by examining the difference in borrowing costs for commercial banks over a specific time horizon in the future. Chart 1 below showcases the difference in borrowing costs – the spread – for the May 2022 and December 2023 contracts, in order to gauge where interest rates are headed by December 2023.
Eurodollar Futures Contract Spread (May 2022-December 2023) [BLUE], US 2s5s10s Butterfly [ORANGE], DXY Index [RED]: Daily Timeframe (April 2021 to April 2022) (Chart 1)
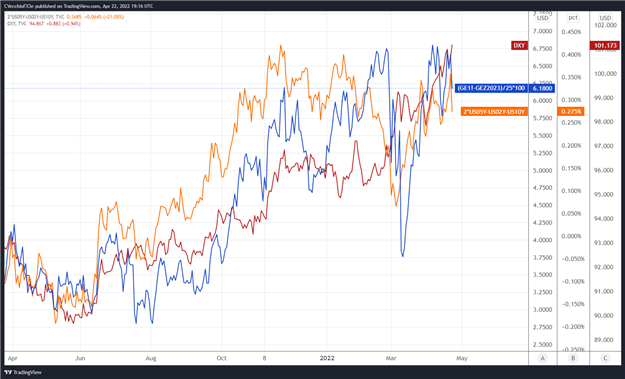
By comparing Fed rate hike odds with the US Treasury 2s5s10s butterfly, we can gauge whether or not the bond market is acting in a manner consistent with what occurred in 2013/2014 when the Fed signaled its intention to taper its QE program. The 2s5s10s butterfly measures non-parallel shifts in the US yield curve, and if history is accurate, this means that intermediate rates should rise faster than short-end or long-end rates.
After the Fed raises rates by 50-bps in May, there are six 25-bps rate hikes discounted through the end of 2023 thereafter. The 2s5s10s butterfly has traded sideways in recent weeks, suggesting that the market has retained its overall hawkish interpretation of the near-term path of Fed rate hikes. Focus remains more on the Fed and less on Russia’s invasion of Ukraine.
Read more: Central Bank Watch: Fed Speeches, Interest Rate Expectations Update
US Treasury Yield Curve (1-year to 30-years) (April 2020 to April 2022) (Chart 3)
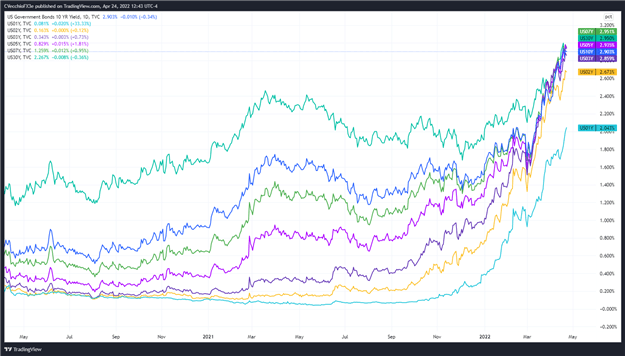
The shape of the US Treasury yield curve coupled with elevated Fed rate hike odds continues to underpin US Dollar strength. The rebound in US real rates (nominal less inflation expectations) further supports what has been a rapid rise by the greenback throughout April. As it stands, it appears that markets are expecting the Fed to raise rates in 50-bps increments in each of the next few meetings, another significant bonafide for the greenback (particularly given the growing chasm between expectations among the Fed, Bank of Japan, and European Central Bank).
CFTC COT US Dollar Futures Positioning (April 2020 to April 2022) (Chart 4)
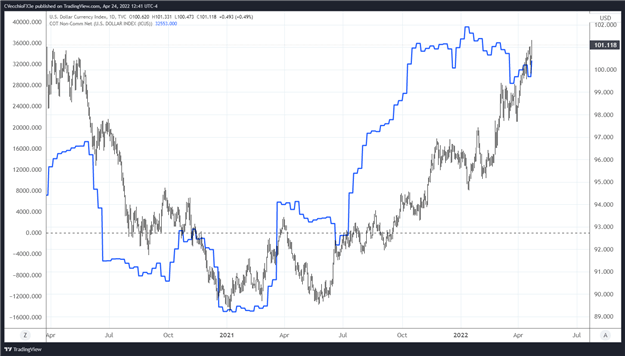
Finally, looking at positioning, according to the CFTC’s COT for the week ended April 19, speculators increased their net-long US Dollar positions to 32,553 contracts from 29,620 contracts. Net-long US Dollar positioning has proved relatively stable over the past seven months, going back to early-October 2021.
— Written by Christopher Vecchio, CFA, Senior Strategist

