

US Dollar (DXY) Price and Chart Analysis
Recommended by Nick Cawley
Get Your Free USD Forecast
The latest rally in US Treasury yields has seen the short-end of the market post multi-year highs as traders continue to price in further Fed hawkishness. A total of 150 basis points of rate hikes are priced in over the next two Fed meetings, suggesting a target rate of 4.50% – 4.75%, and if inflation has not started to move by the end of the year, it is likely further rate hikes will be seen in Q1 2023. Speaking yesterday, Fed board member Patrick Harker said that the central bank will stop hiking rates sometime in 2023 to assess their impact, but admitted that so far the Fed has made little progress in lowering inflation.
The US dollar basket (DXY) is back above 113.00 and is set to make a fresh attempt at the recent 114.72 high. Next week’s US data may help the next move with US Q3 adv GDP, released on October 27 at 13:30 BST, battling with US Core CPE, released on October 28 at 13:30 BST, as the main driver of the greenback next week.
For all market moving data releases and economic events see the real-time DailyFX Calendar.
Looking at the 2-year UST, a confirmed break of prior resistance at 4.36% has allowed a fresh move higher.
US Treasury 2-Year Yield
Chart via TradingView
The rally in the UST 10-year is even more pronounced and yields are now back at levels last seen 15 years ago.
US Treasury 10-Year Yield
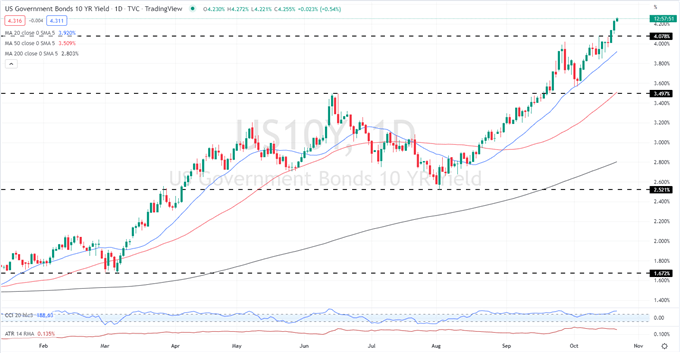
Chart via TradingView
US dollar strength against the Japanese Yen has been a one-way trade for the last year with the pair rallying from 109 this time last year to a current 32-year high at 150.75. While a large portion of this move is Japanese Yen weakness, US dollar strength has helped accelerate the pair ever higher.
USD/JPY Update: USDJPY Trades Above 150 as FX Intervention Looms, CPI at 3%
USDJPY Daily Price Chart
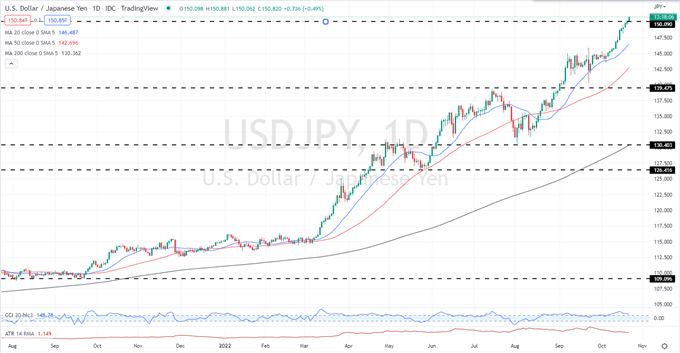
Chart via TradingView
Another currency pair that has weakened appreciably over the past months is the closely-watched USDCNH. The ongoing move higher in the pair makes Chinese exports to the US cheaper, and US exports to China more expensive, a situation the US government is watching closely.
USDCNH Weekly Price Chart
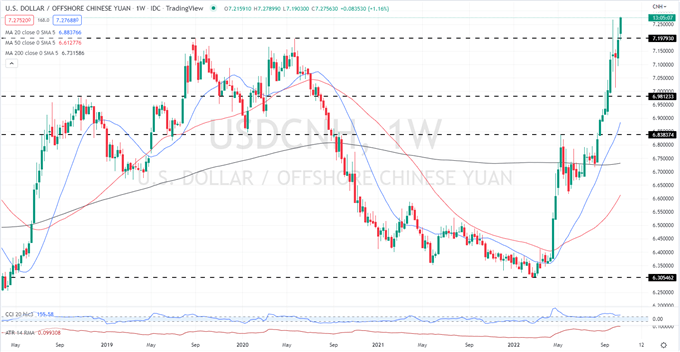
Chart via TradingView
What is your view on the US Dollar – bullish or bearish?? You can let us know via the form at the end of this piece or you can contact the author via Twitter @nickcawley1.
