Trend reversals, these is the type of market condition where many traders can either make huge profits or huge losses. Traders who make it a habit to chase price end up trading in the direction of a dying trend. Those who do not practice protecting their equity by using stop losses or hedges may end up losing a huge portion of their trading accounts. On the other hand, the few traders who were able to anticipate the trend reversal may be in for a great ride. They could be making huge profits because they could be entering a trade at the start of a trend and could exit the trade when the trend reverses again.
Trading trend reversals are quite difficult yet could also be very fulfilling. It is difficult because it is not easy to anticipate trend reversals. It is rewarding because of the potential of exponential profits.
Often, traders use a confluence of trend reversal signals in order to anticipate a trend reversal. Confluences are very powerful because these are points where signals coming from different trend reversal setups converge. Often, these are areas where many traders could observe a potential trend reversal and take a trade.
Trend Reversal Synergy Forex Trading Strategy is a systematic trend reversal trading strategy which trades on confluences of reversal signals coming from three high probability trend following and momentum indicators.
Heiken Ashi Smoothed Indicator
The Heiken Ashi Smoothed indicator is a trend following indicator based on the Heiken Ashi Candlesticks.
In Japanese, Heiken Ashi literally means “average bars”. This is what Heiken Ashi Candlesticks really are. They are basically candlesticks which takes into account the average movement of price. It still displays the same high and low of the candle, yet it modifies the open and close based on the average movement of price.
Heiken Ashi Smoothed are also average bars. It averages out the historical movement of price. However, instead of displaying a candlestick like price charting, it plots bars that move more closely with moving averages. In fact, the Heiken Ashi Smoothed indicator is more closely related to moving averages such as the Exponential Moving Average than the Heiken Ashi Candlesticks.
This indicator is a very reliable trend following indicator. It plots bars that change colors whenever it detects a trend reversal. It is very responsive to trend reversals yet also manages to reduce false signals due to market noise.
Awesome Oscillator
The Awesome Oscillator (AO) is a trend following technical indicator which is based on the crossing over of two moving average lines.
The Awesome Oscillator references its reading of market trend direction based on the difference between a 5-period Simple Moving Average (SMA) and the 34-period Simple Moving Average (SMA). However, instead of using the standard close of each candle, it uses the median of each candle. The results are then plotted as histogram bars that oscillate around zero.
Trend direction and trend strength using the AO is based on whether the bar is positive or negative and the color of the bar. Positive green bars indicate a strengthening bullish trend, while positive red bars indicate a weakening bullish trend. Negative red bars indicate a strengthening bearish trend, while negative green bars indicate a weakening bearish trend.
RSI Filter
RSI Filter is a momentum technical indicator which is based on the Relative Strength Index (RSI).
The standard RSI is a very versatile indicator. It can provide information regarding trend direction, momentum and overbought or oversold prices.
Trend direction is based on where the RSI line is in relation to its midline.
Momentum is based on the RSI line breaching above 70 or dropping below 30. A breach above 70 could indicate a bullish momentum, while a drop below 30 could indicate a bearish momentum.
The RSI Filter is based on the trend and momentum indications of the RSI. It generates positive bars whenever the RSI line breaches above 70 and continues doing so until the RSI line drops below 50. On the other hand, it plots negative bars whenever it the RSI line drops below 30 and continues doing so until the RSI line breaches above 50.
Trading Strategy
This trading strategy trades on confluences of trend reversal signals coming from the three indicators.
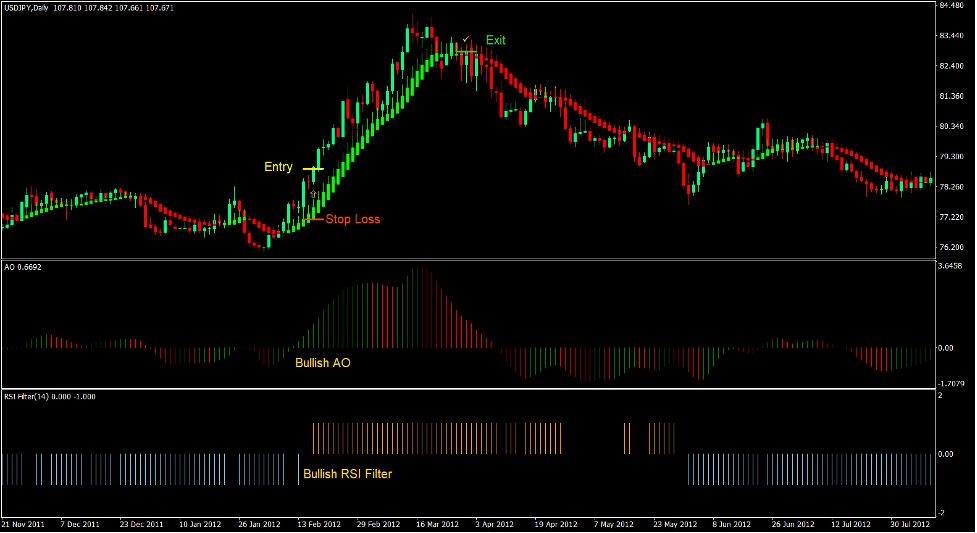
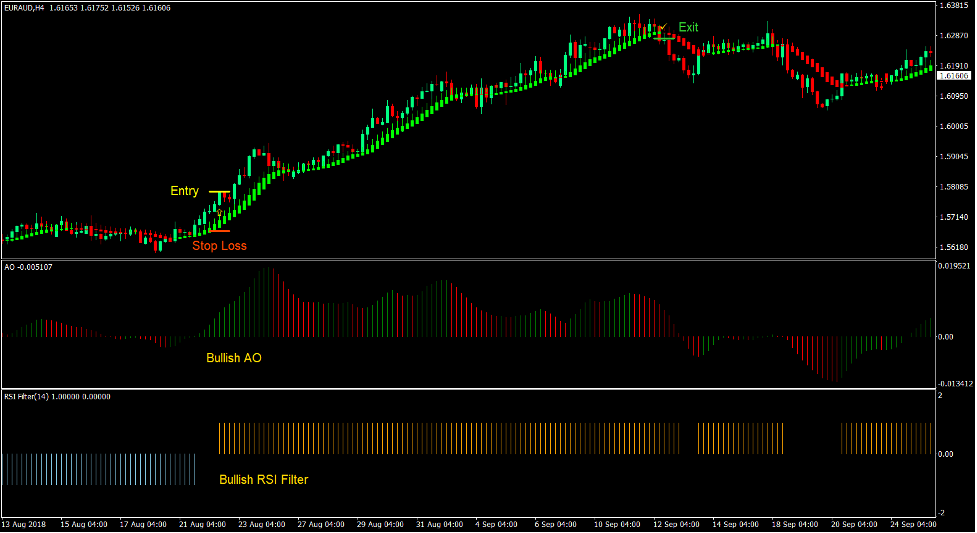
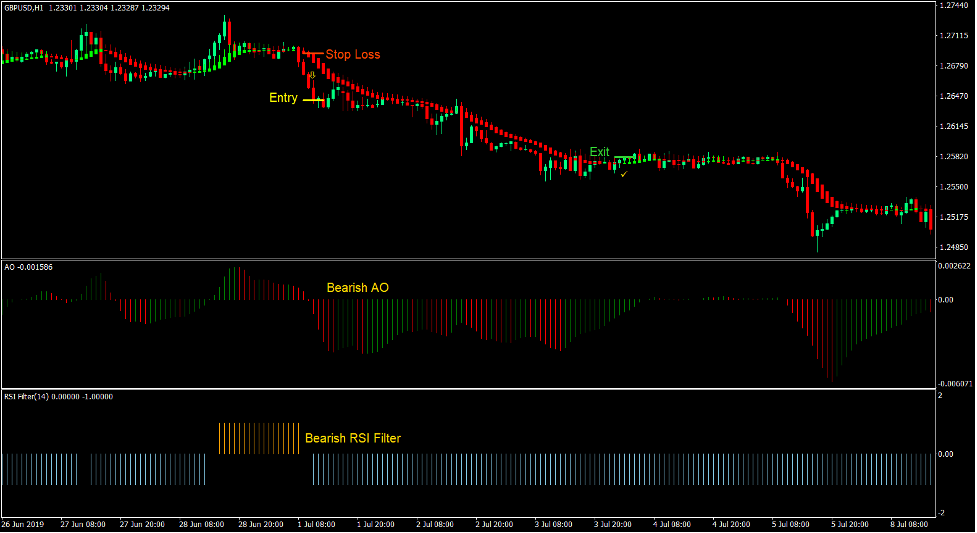
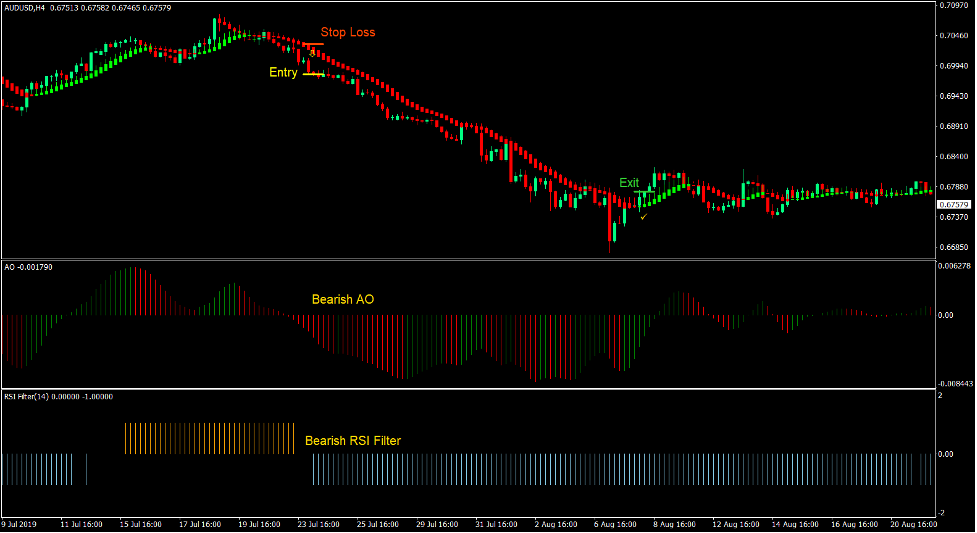
On the Heiken Ashi Smoothed indicator, signals are generated whenever the Heiken Ashi Smoothed bars change colors indicating a possible trend reversal.
On the Awesome Oscillator, signals are generated whenever the bars shift from negative to positive or vice versa.
Then, on the RSI Filter, signals are generated whenever the bars shift from positive to negative or vice versa.
These signals should be somewhat closely aligned. This would indicate that the trend reversal was generated due to a strong momentum shift.
Indicators:
- Heiken_Ashi_Smoothed
- Awesome
- RSIFilter
Preferred Time Frames: 1-hour, 4-hour and daily charts
Currency Pairs: FX majors, minors and crosses
Trading Sessions: Tokyo, London and New York sessions
Buy Trade Setup
Entry
- The Heiken Ashi Smoothed bars should change to lime.
- The Awesome Oscillator bars should shift to positive.
- The RSI Filter bars should shift to positive.
- Enter a buy order on the confluence of these conditions.
Stop Loss
- Set the stop loss below the Heiken Ashi Smoothed bars.
Exit
- Close the trade as soon as the Heiken Ashi Smoothed bars change to red.


Sell Trade Setup
Entry
- The Heiken Ashi Smoothed bars should change to red.
- The Awesome Oscillator bars should shift to negative.
- The RSI Filter bars should shift to negative.
- Enter a sell order on the confluence of these conditions.
Stop Loss
- Set the stop loss above the Heiken Ashi Smoothed bars.
Exit
- Close the trade as soon as the Heiken Ashi Smoothed bars change to lime.


Conclusion
This trading strategy is a basic trend reversal strategy using the confluences of three high probability trend following indicators.
The Awesome Oscillator and the Heiken Ashi Smoothed indicator are very complementary. They would usually produce high quality signals whenever they create trend reversal signals close together.
The RSI Filter adds the confirmation of momentum creating an even stronger case for a trend reversal.
Forex Trading Strategies Installation Instructions
Trend Reversal Synergy Forex Trading Strategy is a combination of Metatrader 4 (MT4) indicator(s) and template.
The essence of this forex strategy is to transform the accumulated history data and trading signals.
Trend Reversal Synergy Forex Trading Strategy provides an opportunity to detect various peculiarities and patterns in price dynamics which are invisible to the naked eye.
Based on this information, traders can assume further price movement and adjust this strategy accordingly.
Recommended Forex MetaTrader 4 Trading Platform
- Free $50 To Start Trading Instantly! (Withdrawable Profit)
- Deposit Bonus up to $5,000
- Unlimited Loyalty Program
- Award Winning Forex Broker
- Additional Exclusive Bonuses Throughout The Year

>> Claim Your $50 Bonus Here <<
Click Here for Step-By-Step XM Broker Account Opening Guide
Recommended Options Trading Platform
- Free +50% Bonus To Start Trading Instantly
- 9.6 Overall Rating!
- Automatically Credited To Your Account
- No Hidden Terms
- Accept USA Residents

How to install Trend Reversal Synergy Forex Trading Strategy?
- Download Trend Reversal Synergy Forex Trading Strategy.zip
- *Copy mq4 and ex4 files to your Metatrader Directory / experts / indicators /
- Copy tpl file (Template) to your Metatrader Directory / templates /
- Start or restart your Metatrader Client
- Select Chart and Timeframe where you want to test your forex strategy
- Right click on your trading chart and hover on “Template”
- Move right to select Trend Reversal Synergy Forex Trading Strategy
- You will see Trend Reversal Synergy Forex Trading Strategy is available on your Chart
*Note: Not all forex strategies come with mq4/ex4 files. Some templates are already integrated with the MT4 Indicators from the MetaTrader Platform.
Click here below to download:
Get Download Access


