

S&P 500 Technical Analysis
- US equities forecasted to see a massive cut in earnings growth in Q4 while remaining positive
- S&P 500 testing the 2022 low
- IG client sentiment hints at a bearish continuation with 65% of traders net long
Recommended by Richard Snow
Get Your Free Equities Forecast
Last week’s better-than-expected NFP data appears to have eliminated hopes of a Fed pivot which saw risk assets perk up in the lead up to the data release. Since then, US equities have continued to sell off and now the S&P 500 (E-mini futures, ES1!) fast approaches the yearly low of 3571.75.
This year’s equity bear market is rather unusual as unemployment has held firm while interest rates have rocketed higher, at a phenomenal pace, leaving many wondering if the worst is still yet to come. S&P 500 earnings growth is forecast to drop by the most in the last two years, declining by 6.6%, according to FactSet. Despite this, the estimated growth rate of the combined S&P 500 is still estimated to be positive, at 2.9% for Q3.
In addition to the actual earnings figures, forward guidance around Q4 earnings is also likely to influence market sentiment. For example, during Q3 earnings season nearly half of the S&P 500 constituent companies cited “recession” alongside their earnings reports, the most in over 10 years. Interest rates and inflation have risen even higher since then, compounding pressure on consumers and businesses.
Technical Analysis
The daily chart shows just how close the S&P 500 index is from printing a new yearly low. The low appears around the September 2020 level of 3590 which deterred further selling at the start of this month. Interestingly enough, the US 10 year treasury yield has backed away from the 4.02% mark which may provide short-term relief to equities due to the dollar following US yields almost in lockstep over the past few weeks. A break below the yearly low opens up the possibility of a 50% retracement of the 2020-2021 major move at 3487, with the February 2020 high of 3397.50 the next noticeable level of support. However, it is worth mentioning that markets continue to remain highly reactive to data and particularly CPI data, which is due on Thursday. A higher print bodes well for trend continuation while a lower figure may provide temporary respite. Resistance appears at the June low of 3639 with 3723 and 3796 thereafter.
ES1! Daily Chart
Source: TradingView, prepared by Richard Snow
The weekly chart helps to show this year’s decline in contrast to the sharp 2020 downturn. In 2020 stocks tumbled 36% while this far we have only seen the index trade around 25% lower from the peak. With interest rates likely to rise and remain elevated for longer than initially expected, US equities could be in for a tough fourth quarter, especially if the yearly low fails to hold.
ES1! Weekly Chart
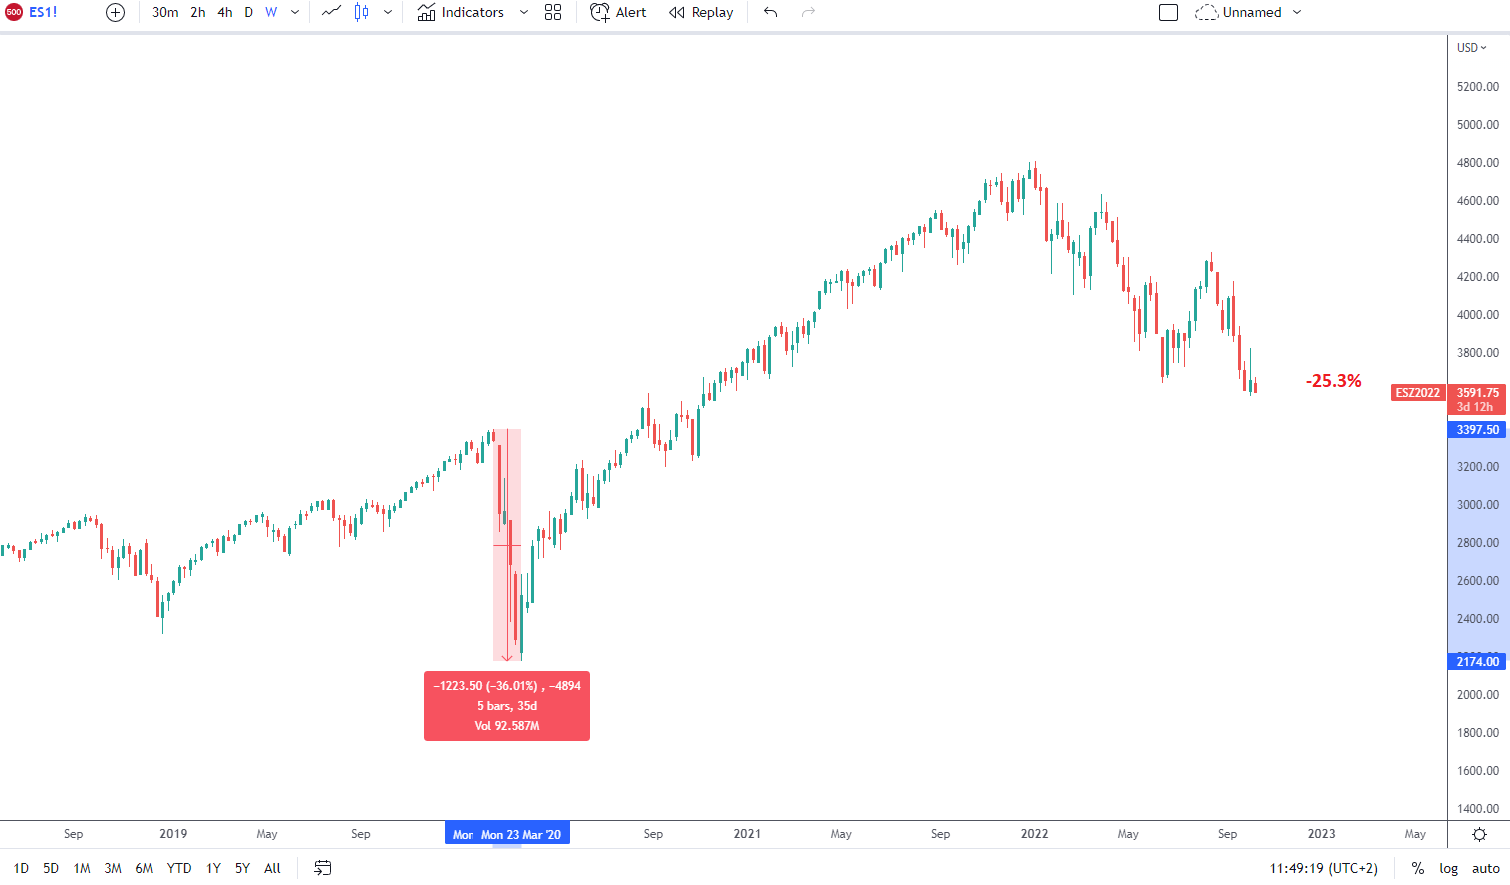
Source: TradingView, prepared by Richard Snow
IG Client Sentiment Hints at Bearish Continuation
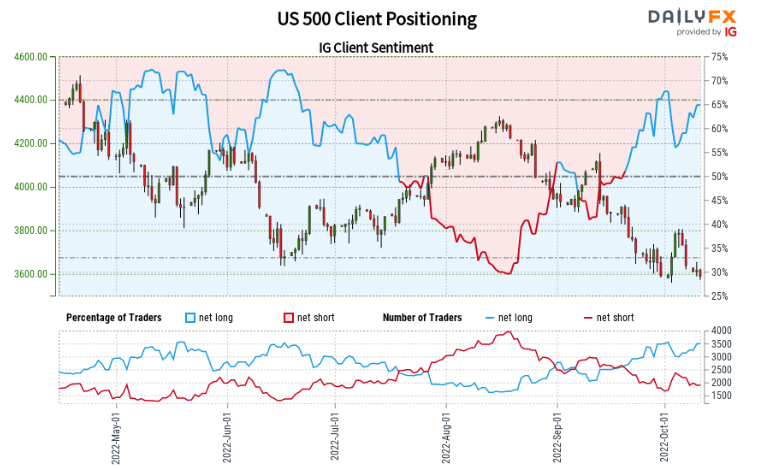
US 500:Retail trader data shows 65.01% of traders are net-long with the ratio of traders long to short at 1.86 to 1.
We typically take a contrarian view to crowd sentiment, and the fact traders are net-long suggests US 500 prices may continue to fall.
The number of traders net-long is 6.15% higher than yesterday and 6.02% higher from last week, while the number of traders net-short is 7.28% lower than yesterday and 5.79% lower from last week.
Traders are further net-long than yesterday and last week, and the combination of current sentiment and recent changes gives us a stronger US 500-bearish contrarian trading outlook.
Trade Smarter – Sign up for the DailyFX Newsletter
Receive timely and compelling market commentary from the DailyFX team
Subscribe to Newsletter
— Written by Richard Snow for DailyFX.com
Contact and follow Richard on Twitter: @RichardSnowFX
