Justin Sullivan/Getty Images News
PayPal (NASDAQ:PYPL) shares may be heading higher after the company reports first-quarter results on April 27. At least, that’s what someone is betting on. It’s undoubtedly a contrarian take, but just look at how much the stock has fallen from its July 2021 peak. PayPal once traded at more than $300 and is now trading nearly 70% off those highs at $89.
The company’s market cap once stood at $360 billion. Now, that market cap is at $103 billion. This was a stock that had a bigger market cap than Bank of America. It isn’t to say that investors had it right; they didn’t, and the valuation made very little sense at the peak. But markets can be irrational when stocks are rising; they also can be irrational when stocks are falling. Next week’s earnings will tell us a lot about the stock from a rational or irrational perspective.
Bloomberg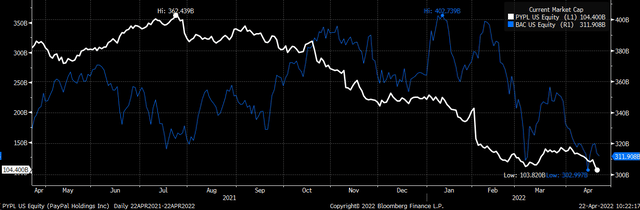
Expectations for PayPal are very low, with analysts forecasting earnings to have dropped by a stunning 28.1% to $0.88 per share in the first quarter. Meanwhile, revenue is expected to have increased by 6.1% to $6.4 billion. Earnings estimates for the year also have collapsed and are reflected in the stock price. What’s stunning is that in September 2019, analysts saw this company earning $5.08 per share by the end of 2022. Now analysts see the company making less in 2022, just $4.63 per share.
Bloomberg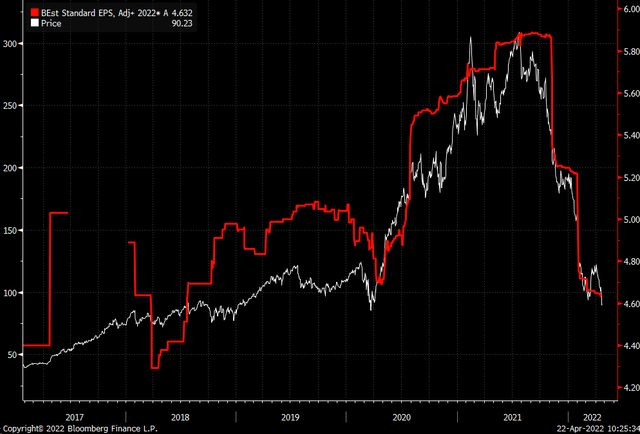
As a result, the stock is trading at its lowest PE ratio since coming public in late 2015. There’s a lot of bad news priced into this stock, and unless earnings continue to drop, it appears to be too cheap. That will make the company guidance key, and if the company gives guidance that’s in line with full-year 2022 estimates, then the stock probably rebounds following results.
The historically low PE ratio means that the market doesn’t believe the current estimates that analysts have laid out and that those estimates will continue to drop. That’s why this company needs to show that its outlook isn’t getting worse and has, at the very least, stabilized.
Analysts estimate revenue will grow 13.9% to $7.1 billion for the second quarter, and earnings will drop by 2.6% to $1.12 per share. The full-year estimates are for revenue growth of 15.5% to $29.3 and earnings to grow by 70 bps to $4.63 per share.
Bloomberg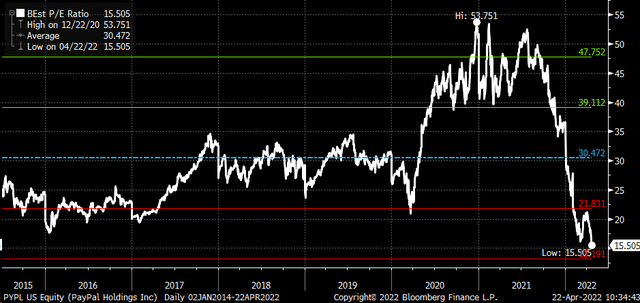
Hoping For A Miracle
The dire outlook has someone placing a rather large bet that things aren’t as bad as they seem for PayPal. The open interest for the May 20 $100 calls and puts rose by almost 10,000 contracts each on April 20. The data shows the calls were bought on ask for $9.55 per contract, meanwhile, the puts were traded at the mid-point for $5 per contract. According to the data, the trader paid $4.55 per contract, which indicates the trader took in the $5 put premium and that those put contracts were sold. It’s a bullish bet and suggests that PayPal is trading at over $104.55 by the expiration date.
Near Pandemic Lows
The stock has been trending lower and heading toward its pandemic lows of $83.40. If that level breaks, the next support level is at $76. But there are some signs of a bullish divergence forming, with the RSI making a higher high and its potential to make a higher low. It could be the early sign of the stock starting a trend reversal.
If the stock can hold $83, it’s likely to rebound back to $92.60 and potentially as high as $106.
TradingView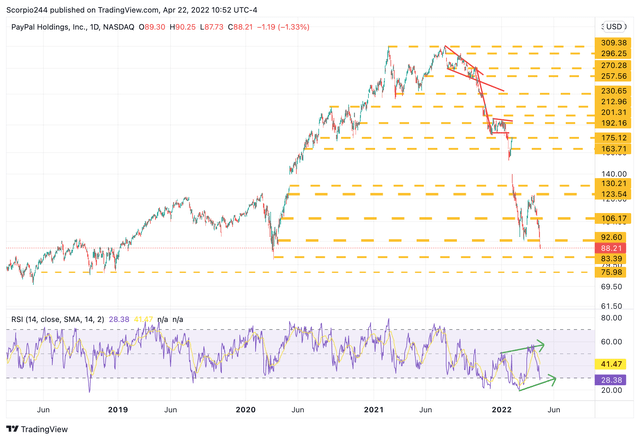
The earnings will be crucial because if the company can show that things aren’t getting worse, then the stock could rebound because the shares have never been cheaper from a valuation perspective. But it’s important to remember sometimes things can always get even cheaper.
Guidance is key.
Investing today is more complex than ever. With stocks rising and falling on very little news while doing the opposite of what seems logical. Reading the Markets helps readers cut through all the noise delivering stock ideas and market updates, looking for opportunities.
We use a repeated and detailed process of watching the fundamental trends, technical charts, and options trading data. The process helps isolate and determine where a stock, sector, or market may be heading over various time frames.
To Find Out More Visit Our Home Page