

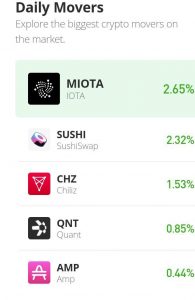
MIOTA Price Prediction – July 10
The IOTA/USD market now trades at lower-range spots after a long line of significant crashes in its valuation. It’s noteworthy to state the market’s all-time high and all-time low values as it records $5.69 and $0.07962 at a 3.86% positive.
MIOTA (IOTA) Price Statistics:
IOTA price now – $0.3016
IOTA market cap – $835.8 million
IOTA circulating supply – 2.78 billion
IOTA total supply – 2.78 billion
Coinmarketcap ranking – #36
MIOTA (IOTA) Market
Key Levels:
Resistance levels: $0.40, $0.50, $0.60
Support levels: $0.20, $0.15, $0.10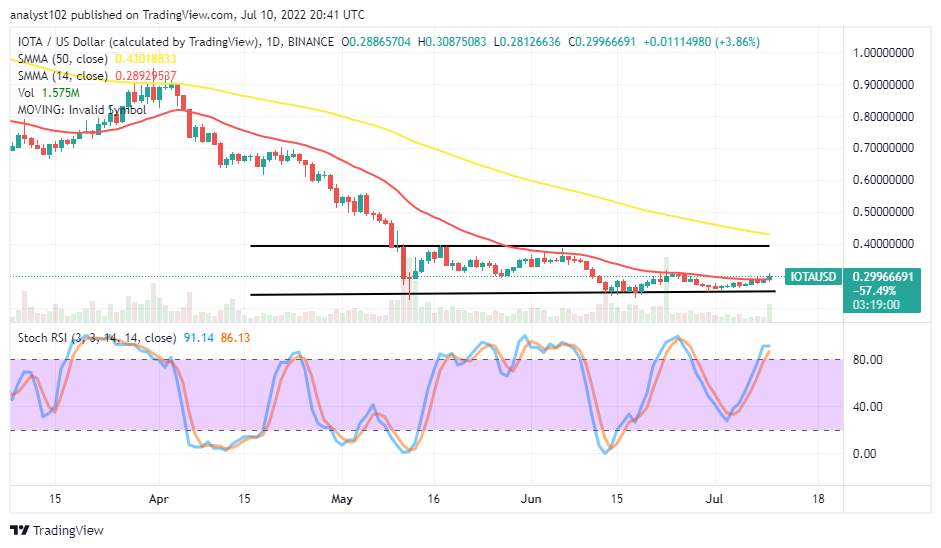
IOTA/USD – Daily Chart
The IOTA/USD daily chart showcases the crypto-economic market trades at lower-range spots. Variant smaller-bearish candlesticks have featured around the trend line of the smaller SMA. The 14-day SMA indicator is underneath the 50-day SMA indicator. The lower horizontal range line drew near below the $0.20 support level as the upper horizontal range line is at the $0.40 resistance level. The Stochastic Oscillators are in the overbought region, trying to close within.
Will the IOTA/USD market push higher past its 14-day SMA level?
It observed the IOTA/USD market has recently swung from a lower-trading spot below the $0.20 support level to now bargain around the 14-day SMA trend line. Presently, the crypto economy trades in well-defined lower-range spots. The market cannot surge northward in the near time past above the trend line of the 14-day SMA as of the moment of writing. Therefore, long-position takers would have to exercise patience for a while.
On the downside, the crypto trade seems to prepare for another cycle of downward-trending motions around the smaller-SMA indicator. The resistance value line in focus is at around $0.30 approximately. Thus, bears are to re-energize around it to push back against the subsequent upswings. On the contrary, the price may rally further for a test of the $0.40 resistance before sellers can make a comeback afterward.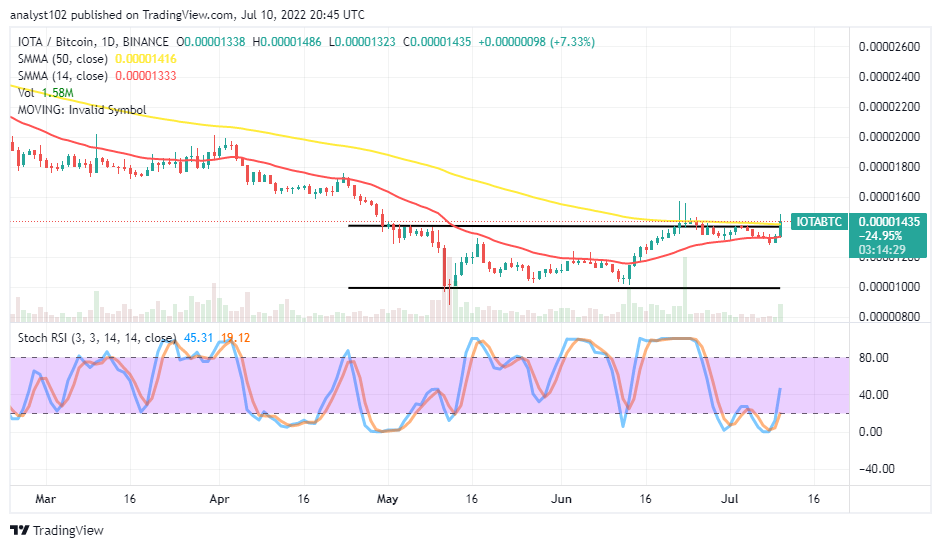
IOTA/BTC Price Analysis
Comparing MIOTA’s catalyst to the trending ability of Bitcoin has been striving to move upward to gather some momentum. The cryptocurrency pair price trades at lower-range spots that are well-defined. The 14-day SMA indicator has drawn northward closely beneath the 50-day SMA indicator. The upper horizontal line drew tightly below the bigger SMA. The Stochastic Oscillators have crossed northbound from the oversold region to reach the 40 range. The base crypto needed to maintain featuring a bullish candlestick around the bigger SMA to push more highs against the flagship countering crypto.

Our Recommended Crypto Exchange for U.S. customers
- 120+ Cryptos Wallet Available
- Paypal available
- Licensed and regulated in the U.S.
- Social trading Platform & copy trading
- Low trading fees
68% of retail investor accounts lose money when trading CFDs with this provider.
Read more:
