Many people hear about forex trading and how it is capable of growing people’s money by several folds in just a matter of a short period of time. This would usually peak people’s interest. However, people also have this notion that trading is very difficult and should only be dabbled upon by highly intellectual people.
This notion cannot be farther from the truth. Although traders should have a certain level of intellect that would allow them to understand what they are doing, but it does not really require much for one to be a trader. In fact, simple strategies have been proven to work many times. Traders who can stick to such a simple plan often reap the rewards of earning profits from the forex market.
Crossover strategies are some of the simplest trading strategies that a trader can implement. In fact, many new traders are introduced to this type of strategy when they first begin trading. However, many would have mixed results. This is because crossover strategies work well in markets that has a strong tendency to trend yet would fail when used in a ranging market condition.
One of the ways to improve the probability of getting a winning trade setup using a (Ideal MA MACD Cross Forex Trading Strategy) a crossover strategy is using pullbacks or retests. This allows traders to have more confirmation on a new trend rather than blindly following a crossover strategy.
2PB Ideal 3 MA
2PB Ideal 3 MA is a custom technical indicator based on moving averages.
Moving averages are some of the most useful technical indicators which trend following and trend reversal traders use. This is because moving averages are very ideal for identifying trends.
One of the ways traders use moving averages to identify trends is by observing the direction of the slope of the moving average line. If the slope is upward, then the market is in an uptrend. If the slope is downward, then the market is in a downtrend. Another is by looking at the location of price action in relation to the moving average line. If price action is above the moving average, then the market bias is bullish. If price action is below the moving average, then the market bias is bearish. Traders also use moving average crossovers to identify a trend reversal. A cross up would indicate a possible bullish trend reversal. A cross down would indicate a possible bearish trend reversal.
Moving averages are very useful, however, moving averages also tend to be easily susceptible to whipsaws during choppy markets. A good moving average would have a balance between being responsive to price movements yet at the same time is less susceptible to whipsaws.
2PB Ideal 3 MA is modified in order to smoothen out the response of the moving average line. This creates a moving average line which is less susceptible to whipsaws. When paired with a complementary moving average line, the 2PB Ideal 3 MA can produce excellent trend reversal signals.
OsMACD
OsMACD is another custom technical indicator which is a part of the oscillator family of indicators. It is also based on the widely used Moving Average Convergence and Divergence (MACD) indicator.
The OsMACD is based on the divergence and convergence of two moving averages. This is basically the difference between two moving averages. This indicator uses Exponential Moving Averages (EMA) to arrive at the difference and is setup with the faster EMA at 12 bars and the slower EMA at 26 bars. The result is then plotted as histogram bars. Then, a Signal Line is derived from the histogram bars. The signal line is basically a Simple Moving Average (SMA) of the MACD histogram bars. This indicator also allows traders to modify the source of price, whether it is the close of the candle, high, low or the median.
Bars and lines above zero indicate a bullish directional bias, while bars and lines below zero indicate a bearish directional bias. Traders can also identify probable trend reversals based on the crossover of the histogram bars and the signal line. Dots are also plotted indicating the difference between the MACD histogram bars and the signal line. Positive dots indicate that the directional bias is bullish, while negative dots indicate that the directional bias is bearish. The bars, line and dots also change color to indicate momentum. This is based on its current value compared to the previous value. Blue indicates a strengthening bullish momentum, while red indicates a strengthening bearish momentum.
Trading Strategy
This trading strategy is a simple crossover trend reversal strategy.
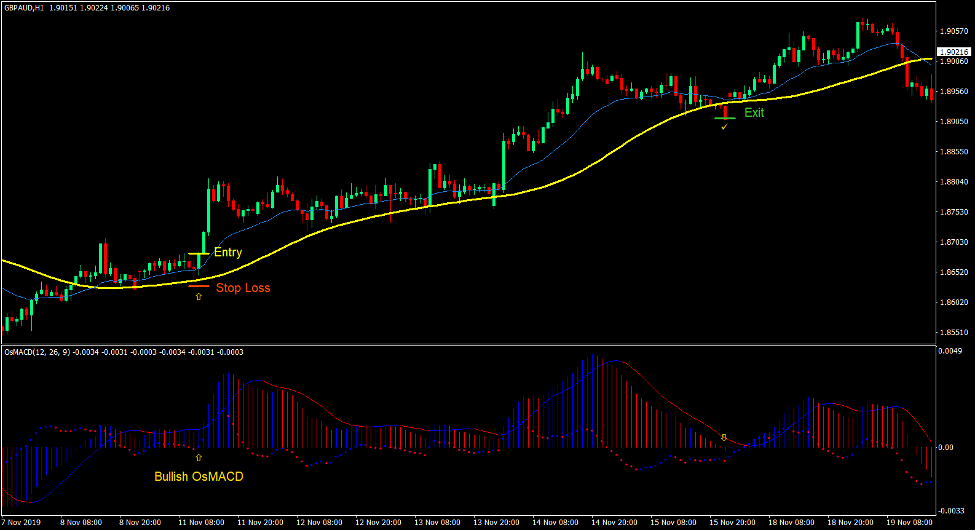
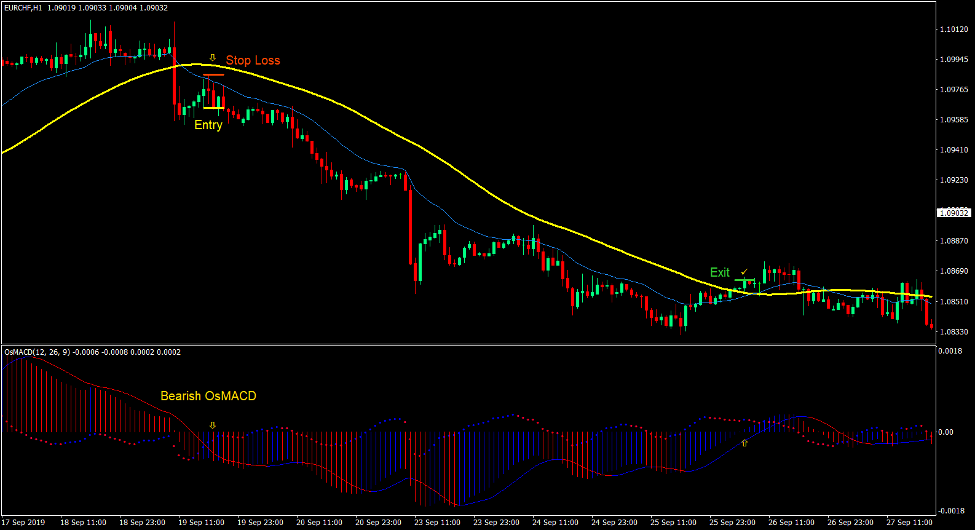
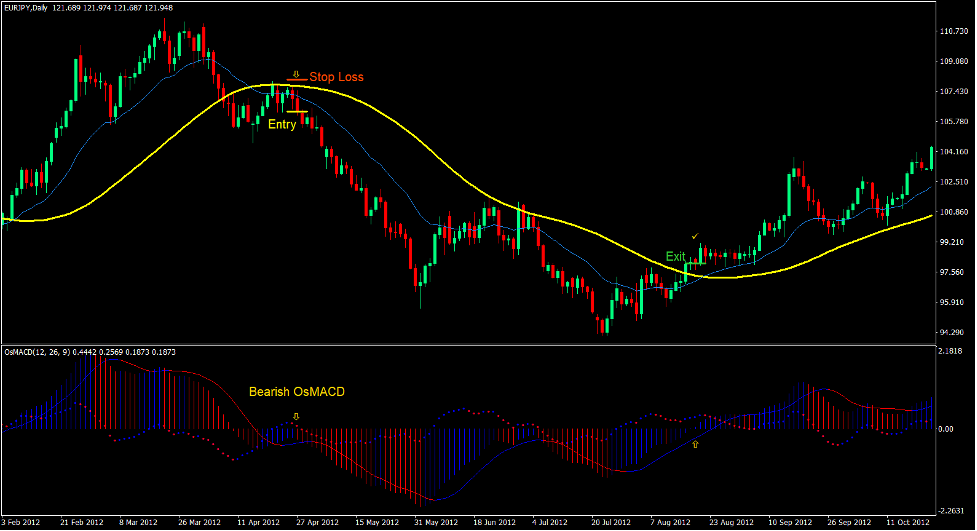
Trend reversal signals are generated whenever the 20-period Exponential Moving Average crosses over the 2PB Ideal 3 MA line. This trend reversal should also be confirmed by the OsMACD histogram bars and lines crossing the midline, which is zero.
However, instead of taking the trade right away, we should wait for a price action confirmation. This is basically a pullback towards the moving average lines followed by a price rejection on the area of the moving average lines.
If these conditions are met, then we have a valid trend reversal setup.
Indicators:
- 2pbIdeal3MA
- OsMACD
- 20 EMA
Preferred Time Frames: 1-hour, 4-hour and daily charts
Currency Pairs: FX majors, minors and crosses
Trading Sessions: Tokyo, London and New York sessions
Buy Trade Setup
Entry
- Price action should cross above the moving average lines.
- The 20 EMA line should cross above the 2PB Ideal 3 MA line.
- The OsMACD bars and lines should cross above zero.
- Price action should pull back towards the moving average lines and reject the area.
- The OsMACD bars should change to blue.
- Enter a buy order on the confirmation of these conditions.
Stop Loss
- Set the stop loss on the fractal below the entry candle.
Exit
- Close the trade as soon as the OsMACD bars cross below zero.


Sell Trade Setup
Entry
- Price action should cross below the moving average lines.
- The 20 EMA line should cross below the 2PB Ideal 3 MA line.
- The OsMACD bars and lines should cross below zero.
- Price action should pull back towards the moving average lines and reject the area.
- The OsMACD bars should change to red.
- Enter a sell order on the confirmation of these conditions.
Stop Loss
- Set the stop loss on the fractal above the entry candle.
Exit
- Close the trade as soon as the OsMACD bars cross above zero.


Conclusion
This trading strategy works well when used in a market or currency pair which has a strong tendency to trend. This is because this strategy allows traders to identify a trend reversal and confirm it based on price action near the beginning of the trend.
Traders who can objectively observe price action can use this strategy to profit from trend reversals in the forex markets.
Forex Trading Strategies Installation Instructions
Ideal MA MACD Cross Forex Trading Strategy is a combination of Metatrader 4 (MT4) indicator(s) and template.
The essence of this forex strategy is to transform the accumulated history data and trading signals.
Ideal MA MACD Cross Forex Trading Strategy provides an opportunity to detect various peculiarities and patterns in price dynamics which are invisible to the naked eye.
Based on this information, traders can assume further price movement and adjust this strategy accordingly.
Recommended Forex MetaTrader 4 Trading Platform
- Free $50 To Start Trading Instantly! (Withdrawable Profit)
- Deposit Bonus up to $5,000
- Unlimited Loyalty Program
- Award Winning Forex Broker
- Additional Exclusive Bonuses Throughout The Year

>> Claim Your $50 Bonus Here <<
Click Here for Step-By-Step XM Broker Account Opening Guide
Recommended Options Trading Platform
- Free +50% Bonus To Start Trading Instantly
- 9.6 Overall Rating!
- Automatically Credited To Your Account
- No Hidden Terms
- Accept USA Residents

How to install Ideal MA MACD Cross Forex Trading Strategy?
- Download Ideal MA MACD Cross Forex Trading Strategy.zip
- *Copy mq4 and ex4 files to your Metatrader Directory / experts / indicators /
- Copy tpl file (Template) to your Metatrader Directory / templates /
- Start or restart your Metatrader Client
- Select Chart and Timeframe where you want to test your forex strategy
- Right click on your trading chart and hover on “Template”
- Move right to select Ideal MA MACD Cross Forex Trading Strategy
- You will see Ideal MA MACD Cross Forex Trading Strategy is available on your Chart
*Note: Not all forex strategies come with mq4/ex4 files. Some templates are already integrated with the MT4 Indicators from the MetaTrader Platform.
Click here below to download:
Get Download Access


