Introduction to the i-High Low Indicator
The i-High Low Indicator is an indicator which makes use of the range of price action in determining the general trend and momentum direction of price. It is a channel type of indicator which is based on the highs and lows of the price range.
What is the i-High Low Indicator?
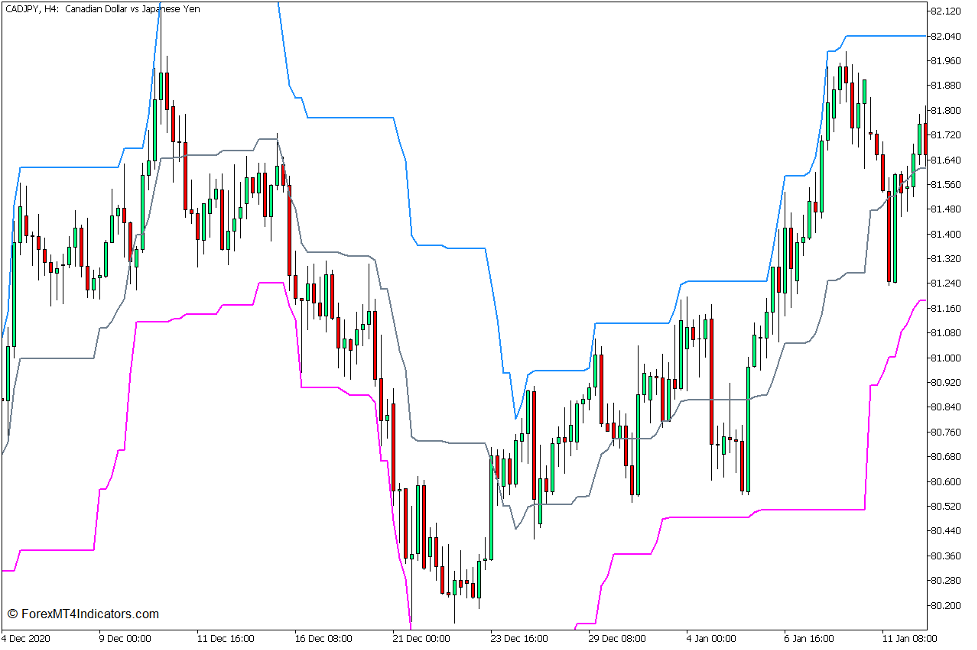
This indicator plots three lines. It plots a gray middle line, a blue upper line, and a magenta lower line. The upper and lower lines indicate the range of the recent price action movements, while the middle line indicates the average of the price range.

How the i-High Low Indicator Works?
This indicator plots the outer lines based on the highs and lows of recent price candles preset at 20 candles back. It also adds an offset from these price extremes preset at 50 points from the extremes.
Using these presets, the upper line is the highest high of the last 20 bars with an offset of 50 points above the high. Inversely, the lower line is the lowest low of the last 20 bars with an offset of 50 points below the lowest low.
The middle line is simply the median of the high and low and is calculated by adding the high and low, then dividing it by two.
How to use the i-High Low Indicator for MT5
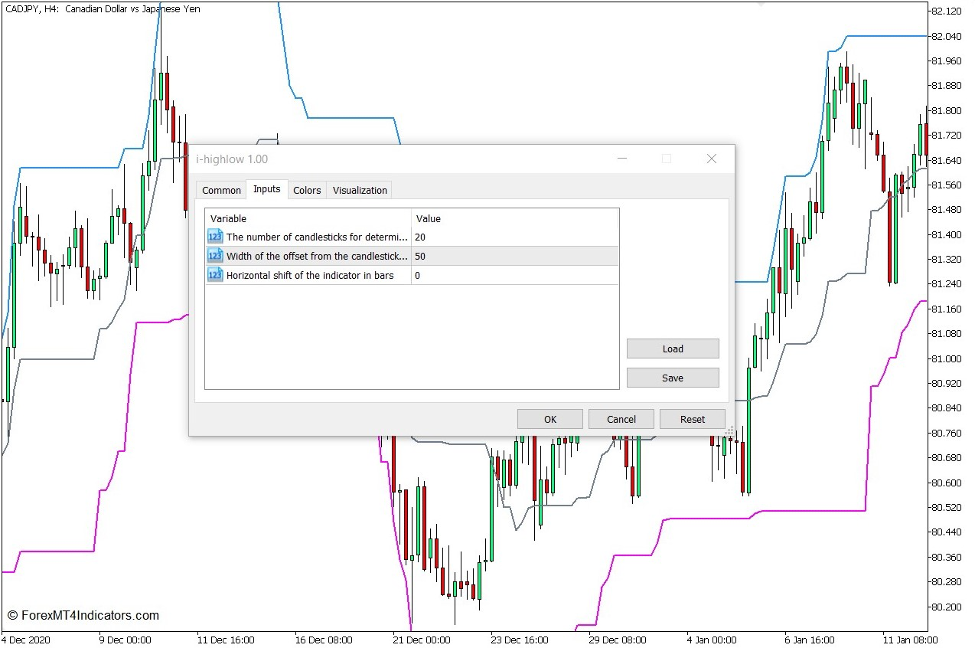
This indicator has three variables which traders can use to adjust the i-High Low channel.
“The number of candles for determining extremum” refers to the number of bars which the highest high and lowest low of price will be based on.
“Width of the offset from the candlestick in points” refers to the number of points which would be added to the highest high and subtracted to the lowest low to determine the channel range.
“Horizontal shift of the indicator bars” allows users to shift the channel forward or back.

This indicator can be used to determine trend or momentum direction based on which half of the channel price action generally is residing.
Traders can also use the middle line as a basis for pullbacks during a trending market condition.
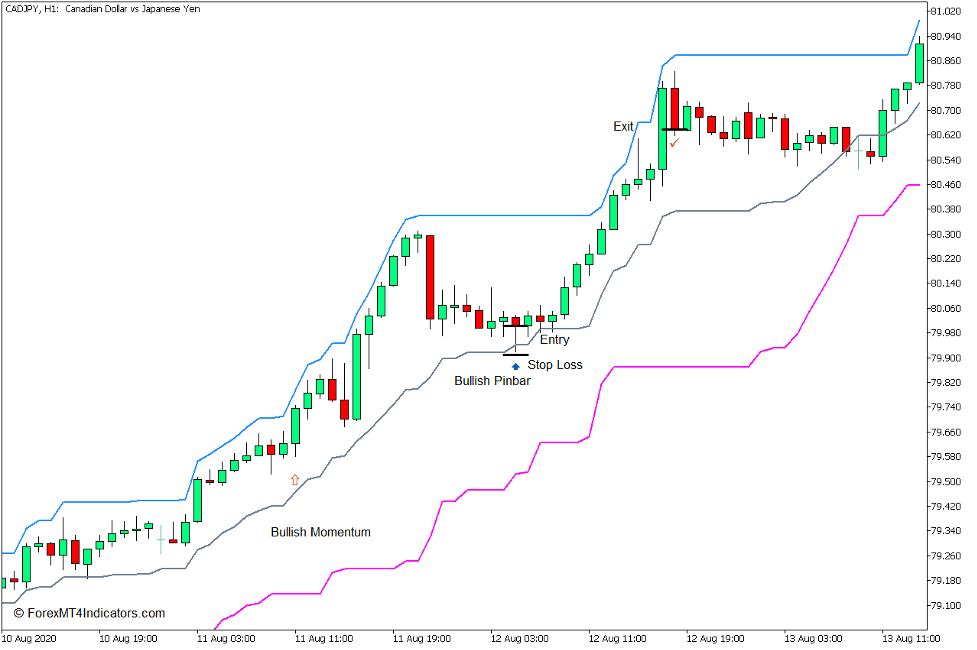
Buy Trade Setup
When to Enter?
Price action should generally be on the upper half of the channel. Wait for price to pullback towards the middle line. Open a buy order as price forms a bullish reversal pattern near the middle line. Set the stop loss below the pattern.
When to Exit?
Close the trade as price action shows signs of a bearish reversal.

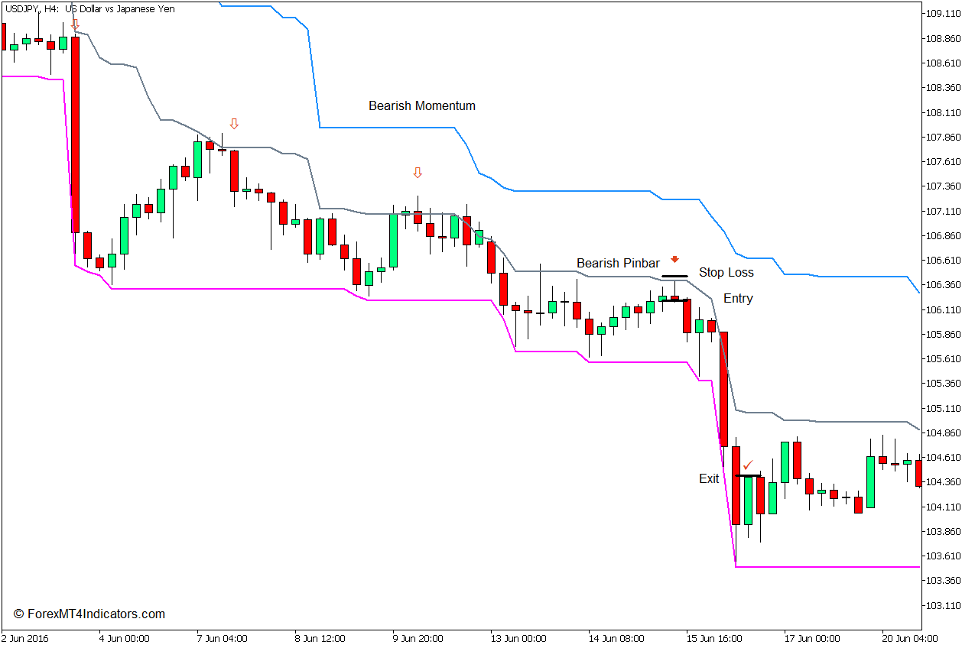
Sell Trade Setup
When to Enter?
Price action should generally be on the lower half of the channel. Wait for price to pullback towards the middle line. Open a sell order as price forms a bearish reversal pattern near the middle line. Set the stop loss above the pattern.
When to Exit?
Close the trade as price action shows signs of a bullish reversal.

Conclusion
The i-High Low Indicator is a tool which can be effectively used for determining trend and momentum direction. Price typically stays on the upper half of the channel in an uptrend, and on the lower half of the channel in a downtrend. However, price action would typically crisscross over the middle line during non-trending markets.
MT5 Indicators – Download Instructions
i-High Low Indicator for MT5 is a Metatrader 5 (MT5) indicator and the essence of this technical indicator is to transform the accumulated history data.
i-High Low Indicator for MT5 provides for an opportunity to detect various peculiarities and patterns in price dynamics which are invisible to the naked eye.
Based on this information, traders can assume further price movement and adjust their strategy accordingly. Click here for MT5 Strategies
Recommended Forex MetaTrader 5 Trading Platforms
#1 – XM Market
- Free $50 To Start Trading Instantly! (Withdrawable Profit)
- Deposit Bonus up to $5,000
- Unlimited Loyalty Program
- Award Winning Forex Broker
- Additional Exclusive Bonuses Throughout The Year

>> Claim Your $50 Bonus Here <<
Click Here for Step-By-Step XM Broker Account Opening Guide
#2 – Pocket Option
- Free +50% Bonus To Start Trading Instantly
- 9.6 Overall Rating!
- Automatically Credited To Your Account
- No Hidden Terms
- Accept USA Residents

How to install i-High Low Indicator for MT5.mq5 to your MetaTrader 5 Chart?
- Download i-High Low Indicator for MT5.mq5
- Copy i-High Low Indicator for MT5.mq5 to your Metatrader 5 Directory / experts / indicators /
- Start or restart your Metatrader 5 Client
- Select Chart and Timeframe where you want to test your mt5 indicator
- Search “Custom Indicators” in your Navigator mostly left in your Metatrader 5 Client
- Right click on i-High Low Indicator for MT5.mq5
- Attach to a chart
- Modify settings or press ok
- Indicator i-High Low Indicator for MT5.mq4 is available on your Chart
How to remove i-High Low Indicator for MT5.mq5 from your Metatrader 5 Chart?
- Select the Chart where is the Indicator running in your Metatrader 5 Client
- Right click into the Chart
- “Indicators list”
- Select the Indicator and delete
i-High Low Indicator for MT5 (Free Download)
Click here below to download:
Download Now


