


Gold Price (XAU/USD), Chart, and Analysis
- The US dollar sell-off is testing prior support.
- Gold needs a driver for a confirmed break of resistance.
Recommended by Nick Cawley
Download our brand new Q4 forecast
The precious metal is running higher on the back of a weaker US dollar and is testing a former area of support turned resistance. Gold will need to make a confirmed break of $1,730/oz. though if the backdrop for the precious metal is to turn bullish.
The US dollar is sitting on a zone of support that has held for the last month and is making a double-bottom pattern in the process. This technical pattern normally suggests a price reversal, from bearish to bullish, but a break of the neckline – currently around 113.85 – is needed to confirm this set-up. A break and open below this area however leaves the US dollar likely to re-test a prior swing high and a cluster of prior lows around the 109.30 level.
Technical Analysis Chart Patterns
US Dollar Currency Index Daily Chart – October 26, 2022
For all market-moving data releases and events, see the DailyFX Economic Calendar.
Trade Smarter – Sign up for the DailyFX Newsletter
Receive timely and compelling market commentary from the DailyFX team
Subscribe to Newsletter
Gold remains stuck in a downtrend with a series of lower highs and lower lows intact. The rebound off the double-low around $1,616/oz. has given the precious metal a slightly more positive outlook but sterner tests lie ahead. Around $10 above the current spot price lies a zone of resistance made off a prior swing low and a cluster of, mainly, failed attempts to break higher. The early October break higher was quickly reversed and this area has held gold at bay over the last 2-3 weeks. If gold can break this area, for the chart to turn positive the last swing low at $1,731/oz. would need to be broken. This may be difficult in the current climate.
Gold Daily Price Chart – October 26, 2022
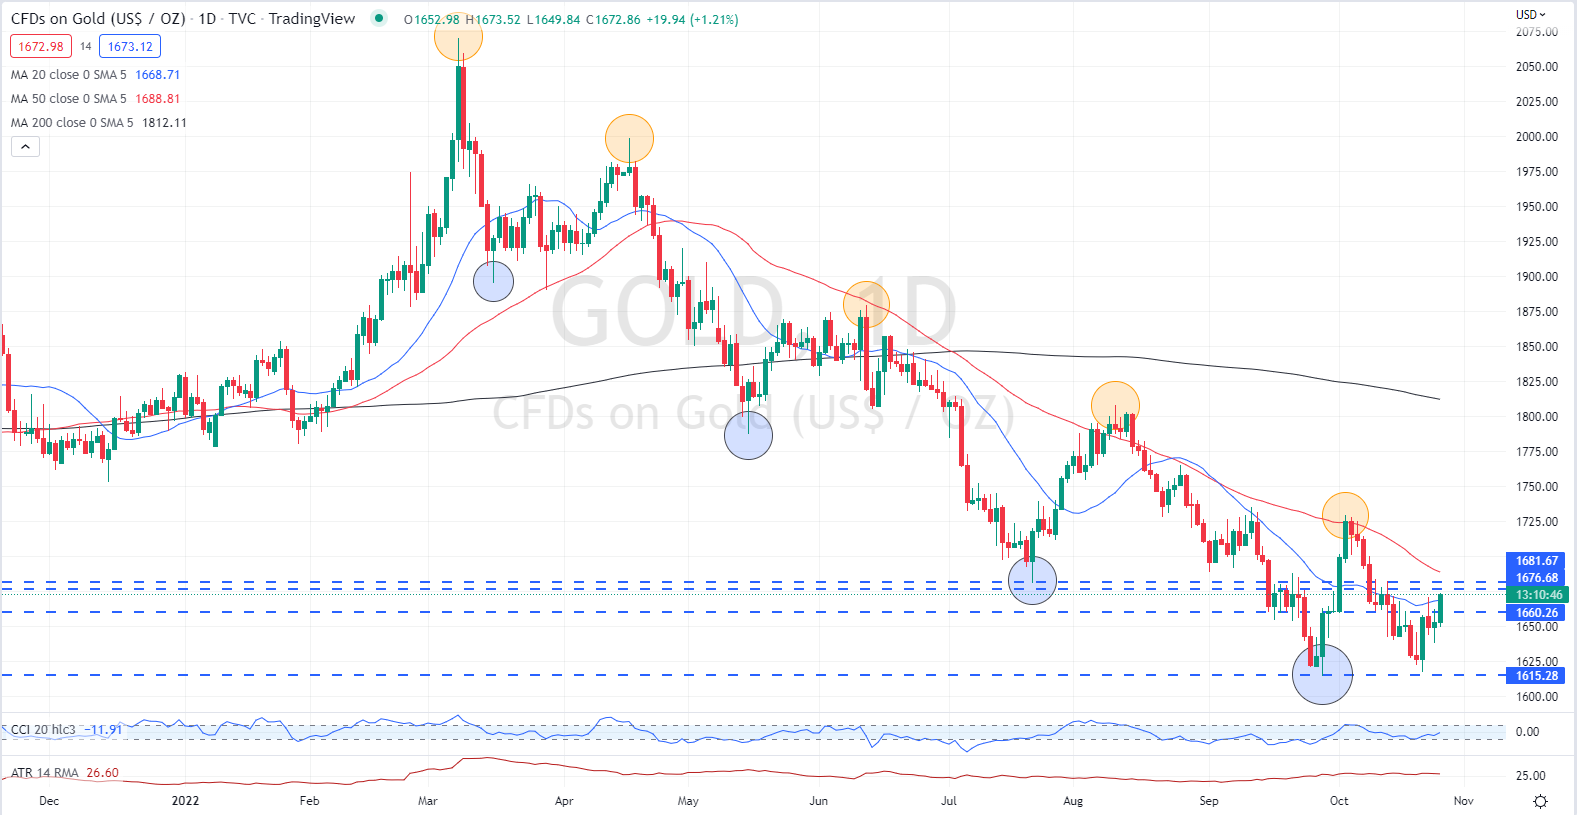

Chart via TradingView
Retail trader data show that 83.91% of traders are net-long with the ratio of traders long to short at 5.22 to 1.The number of traders net-long is 0.87% lower than yesterday and 4.05% higher from last week, while the number of traders net-short is 7.08% higher than yesterday and 6.70% lower from last week.
We typically take a contrarian view to crowd sentiment, and the fact traders are net-long suggests Gold prices may continue to fall. Positioning is less net-long than yesterday but more net-long from last week. The combination of current sentiment and recent changes gives us a further mixed Gold trading bias.
| Change in | Longs | Shorts | OI |
| Daily | -3% | 10% | -1% |
| Weekly | 4% | -2% | 3% |
What is your view on Gold – bullish or bearish?? You can let us know via the form at the end of this piece or you can contact the author via Twitter @nickcawley1.