


FTSE Talking points
- FTSE 100 rises back above 7,000 (at least for now)
- USD weakness and lower yields support risk assets
- GBP/USD rises after climbing back above 1.13
Recommended by Tammy Da Costa
Get Your Free Equities Forecast
Global equities have turned positive after a softer US Dollar and lower yields boosted demand for risk assets. With S&P 500, Dow and tech heavy Nasdaq erasing a portion of recent losses, the FTSE 100 and German DAX 40 have followed suite, capping the downward move.
FTSE 100 Technical Analysis
After three weeks of consecutive losses, a fragile British Pound (GBP) and a struggling economy has weighed on UK stocks, driving FTSE lower. With the downward trajectory currently intact, a confluent zone has formed between key technical levels that may continue to provide both support and resistance for the imminent move.
Recommended by Tammy Da Costa
Get Your Free GBP Forecast
Following a steep decline in September, the FTSE 100 fell towards March lows before running into a big zone of support at the key psychological level of 6,800. With an array of fundamental and political factors influencing investors appetite for risk, a temporary retest of 6,797 allowed bulls to intervene in an effort to regain confidence above 7,000.
FTSE 100 Weekly Chart
Chart prepared by Tammy Da Costa using TradingView
With prices hovering around 7,075, a hold above 7,000 may lead to a retest of the 38.2% Fibonacci retracement of the February – March move at 7,131.46 opening the door for additional gains.
FTSE Daily Chart
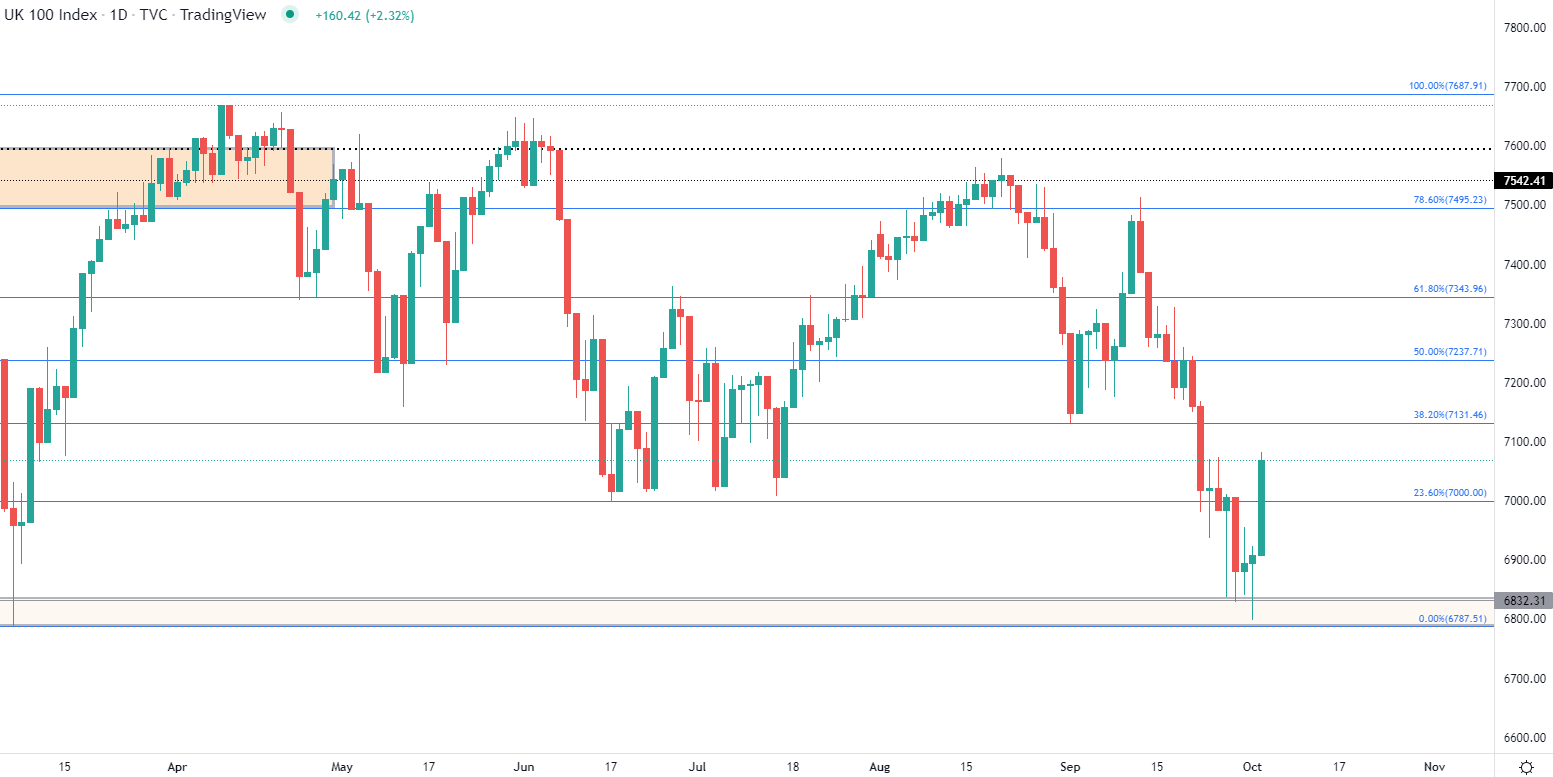

Chart prepared by Tammy Da Costa using TradingView
At the time of writing, FTSE 100:Retail trader data shows 63.46% of traders are net-long with the ratio of traders long to short at 1.74 to 1.The number of traders net-long is 18.59% lower than yesterday and 7.94% lower from last week, while the number of traders net-short is 29.02% higher than yesterday and 6.60% higher from last week.
We typically take a contrarian view to crowd sentiment, and the fact traders are net-long suggesting FTSE 100 prices may continue to fall.
Yet traders are less net-long than yesterday and compared with last week. Recent changes in sentiment warn that the current FTSE 100 price trend may soon reverse higher despite the fact traders remain net-long.
| Support | Resistance |
|---|---|
| S1: 7,000 (Psychological level) | R1: 7,131 (38.2% retracement of the Feb -March move) |
| S2: 6,800 | R2: 7,300 |
| S3: 6,787 (March low) | R3: 7,495 (78.6% retracement of the above-mentioned move) |
— Written by Tammy Da Costa, Analyst for DailyFX.com
Contact and follow Tammy on Twitter: @Tams707