

Recommended by Zorrays Junaid
Get Your Free Equities Forecast
Indices such as the S&P 500, the FTSE 100 and the DAX are currently in a decline since January 2022 high. From my analysis it seems like they are all in a medium-term bearish correction prior to a potential rotation.
Recently, these major indices have formed new lows within their bearish cycle by breaking through the most recent support areas. This will be demonstrated below.
S&P 500 – Daily timeframe
Chart prepared by Zorrays Junaid on Trading View
As per my above chart, price has broken through the red shaded support area which is the extreme of wave A. The S&P 500 can be expected to travel to the downside into wave C and the lower bound of the descending channel can be used as a support region. This is where price is expected to react but of course it is not limited to breaking through the channel to the downside.
FTSE 100 – Daily timeframe
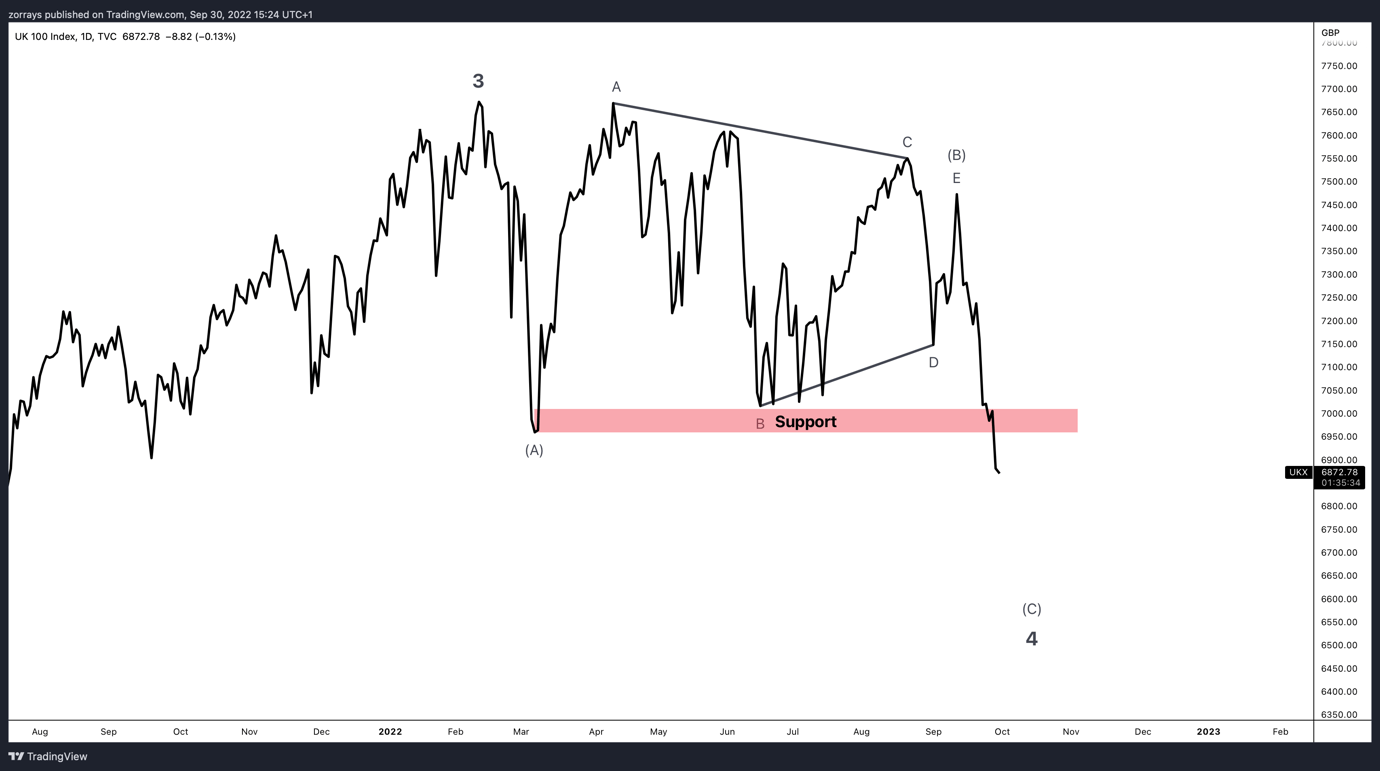
Chart prepared by Zorrays Junaid on Trading View
The FTSE 100 is in a push down as it broke through the support around 7000 after it broke the bearish triangle in wave (B) of 4. Although this price action looks very choppy but in fact this is a Zig Zag pattern with a triangle in wave (B).
Although it may seem like the current price is in no-man’s land, but we can anticipate the minimum area price is potentially looking to reach is wave (C) equals the same length as wave (A).
DAX – Daily timeframe
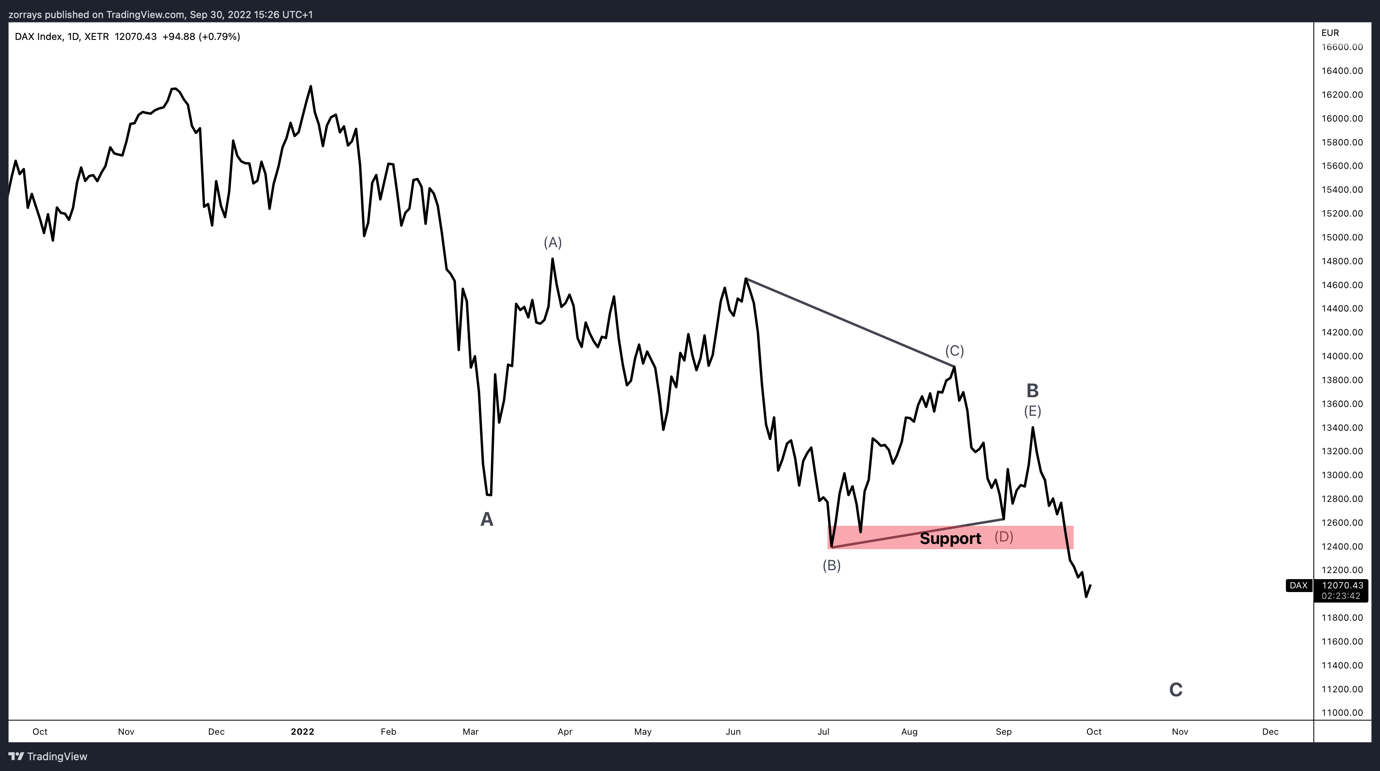
Chart prepared by Zorrays Junaid on Trading View
Very similar to the FTSE 100 as the DAX also had a triangle in wave B. The triangle has been broken out from the downside and broke the support area which was sitting at the extreme of wave (B) of the running triangle. Running triangle’s wave B form a new price extreme.
The consequence of the break of support would be similar to the FTSE 100 where it is expected that wave C would at least reach the same length as wave A.
Trade Smarter – Sign up for the DailyFX Newsletter
Receive timely and compelling market commentary from the DailyFX team
Subscribe to Newsletter
