

Ethereum has slid on its charts again at the time of writing. Over the last week, the coin lost about 10% of its value. The bears have strengthened in the market because the buyers have left the market.
Technical outlook of the coin remained bearish and selling pressure mounted. The coin would continue to remain so over the next trading sessions.
The coin also witnessed a sustained sell-off over the last 48 hours. Ethereum fell below its long standing support line of $1900.Over the last 24 hours the coin tried to recover itself but the bearish price action is still strong at the time of writing. The bears might be exerting pressure to push the coins below the price mark of $1700.
A fall below the $1700 price mark will cause ETH to tumble further by another 19%. For the bulls to take a breather, ETH needs to trade above the $1900 price mark again.
Ethereum Price Analysis: One Day Chart
The altcoin was priced at $1793 at the time of writing. The altcoin has not traded near this price level in almost in one year now. The altcoin’s overhead resistance stood at $1900, for bearish pressure to be invalidated the coin has to attempt trading above the $2200.
Local support for the coin was at $1700 which the coin can trade below if the bears continue to drive the price action. The volume of the coin traded decreased and was seen in green. This indicated positiveness on the chart.
Technical Analysis
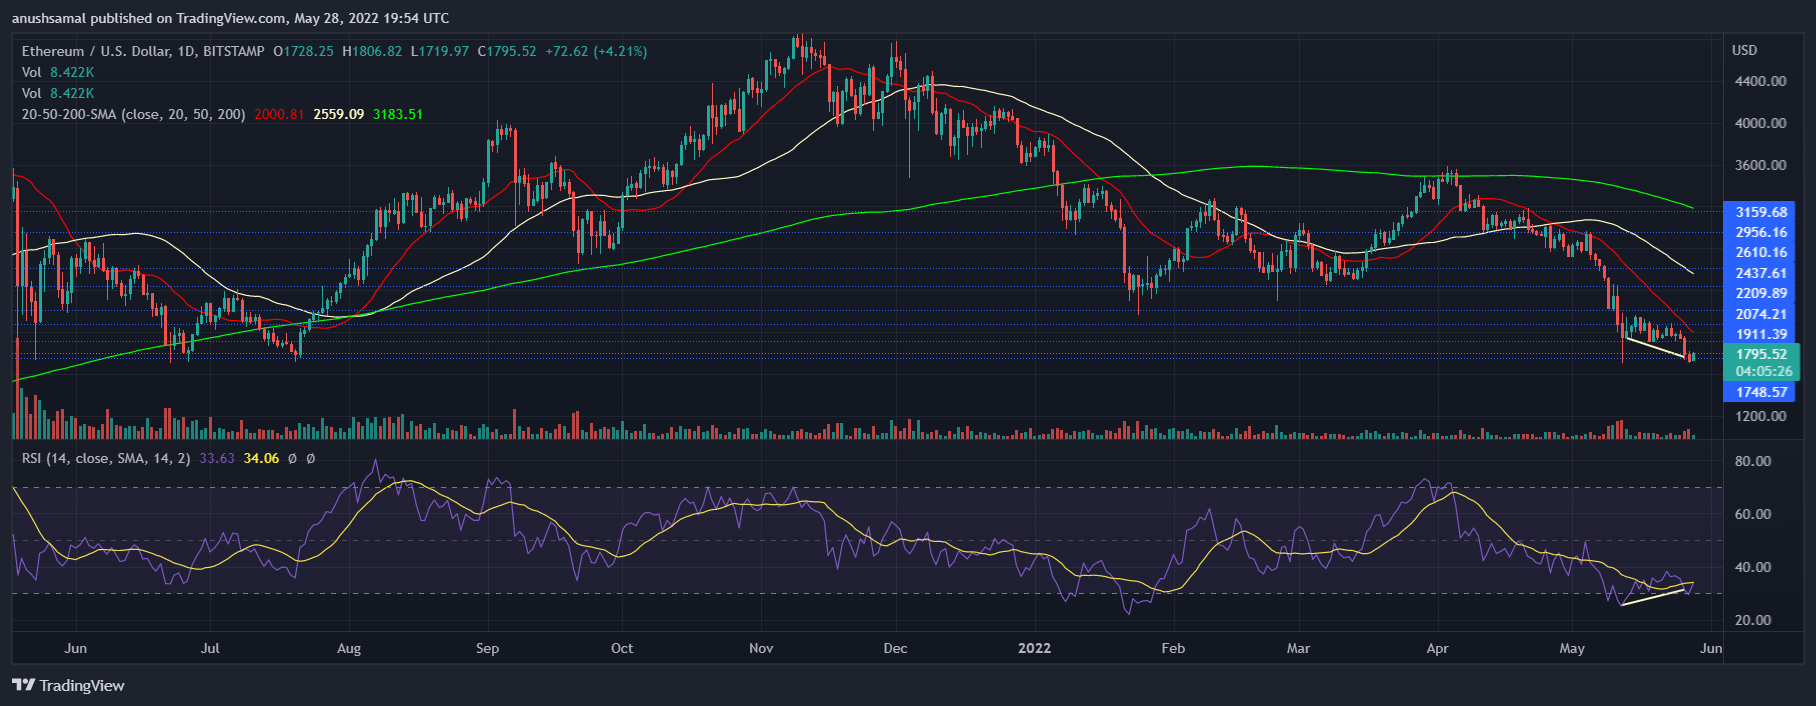
Ethereum was trading very close to the immediate support level. The coin was trading below the 20-SMA line which meant that selling momentum was active and strong. This reading meant sellers were in charge of the price momentum.
In correspondence with the same, the Relative Strength Index was below the half-line. This meant that the buying strength was less in the market. However, it can be noted that, there is an uptick on the RSI which could be a sign that buying strength is picking up momentum.
Chance of a reversal cannot be ruled out because there is a bullish divergence on the chart (yellow). A bullish divergence is related to a trend reversal.
Related Reading | Bearish Indicator: Is Bitcoin Headed For Its Ninth Red Weekly Close?
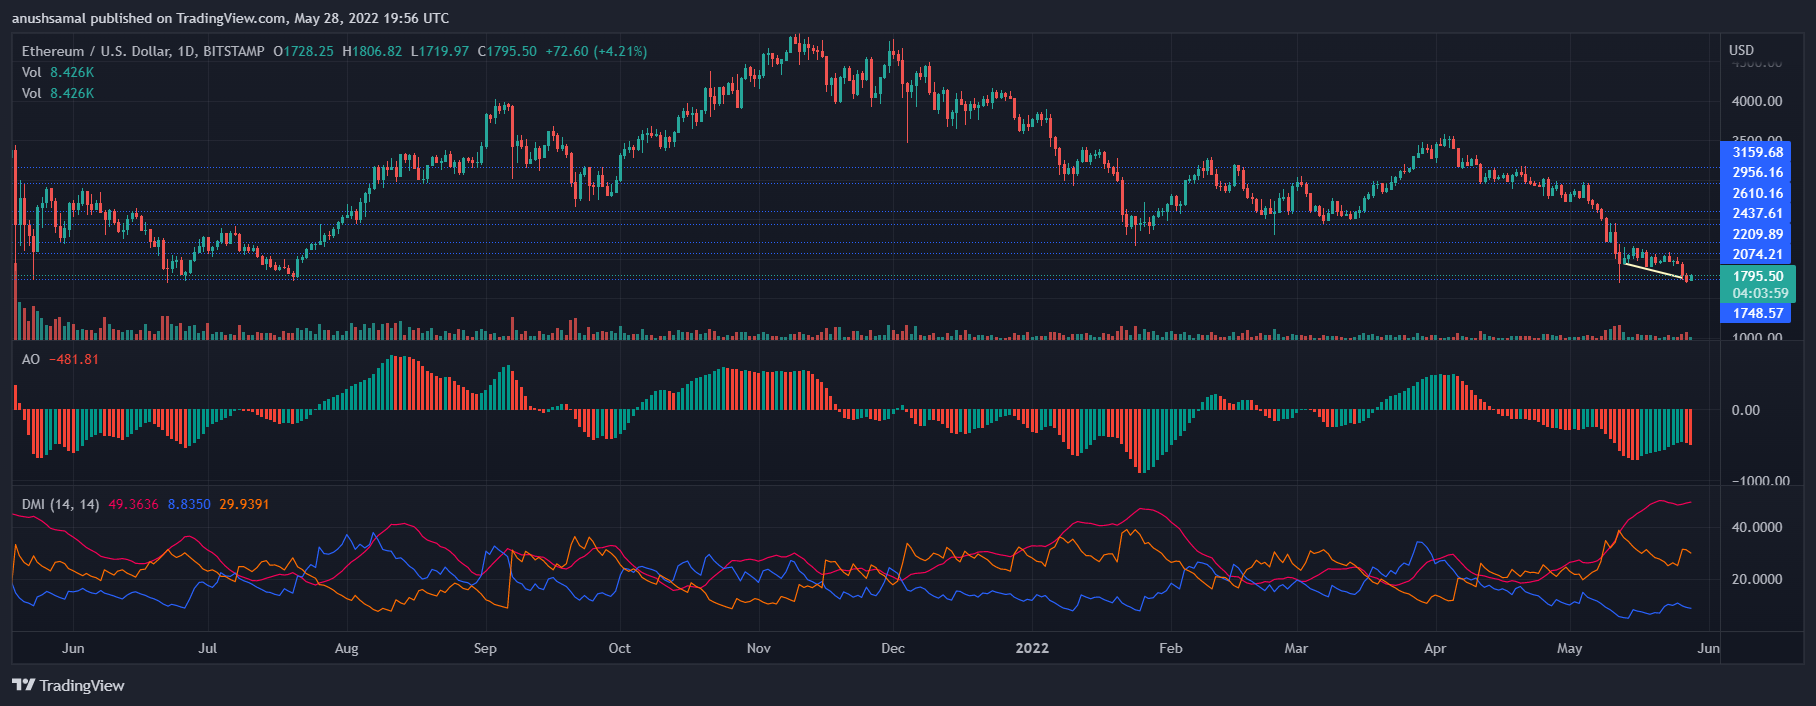
The Awesome Oscillator was still negative on the one day chart. The indicator is supposed to depict the price momentum, the red histograms show negative price action. The red histograms also depict a sell signal on the chart.
The Directional Movement Index also decides the overall price movement, and it showed that -DI was above the +DI level. The Average Directional Index (Red) was above the 40 mark, which meant that the current market trend was strong and the bearishness might continue over the next trading sessions.
Related Reading | Ethereum Profitability Dumps To 2-Year Low As Price Corrects Below $2,000
