

The Ethereum price prediction shows that ETH is now approaching the crucial support, which could hit $1500 support.
Ethereum Prediction Statistics Data:
- Ethereum price now – $1799
- Ethereum market cap – $218.0 billion
- Ethereum circulating supply – 121.0 million
- Ethereum total supply – 121.0 million
- Ethereum Coinmarketcap ranking – #2
ETH/USD Market
Key Levels:
Resistance levels: $2400, $2500, $2600
Support levels: $1200, $1100, $1000
ETH/USD is at the moment trading below the 9-day and 21-day moving averages. However, the Ethereum price has been moving sideways as the bulls attempted to spark another rally. However, in the near term, Ethereum (ETH) may be able to find some support in the lower $1700 level.
Ethereum Price Prediction: Ethereum Price May Touch $1500 Support
According to the daily chart, the Ethereum price keeps ranging as the coin is experiencing a price drop. However, the Ethereum price is moving below the 9-day and 21-day moving averages, which is yet to break below the lower boundary of the channel.

Presently, any further bearish drop below the channel may roll the market down, and this could hit the support levels of $1200, $1100, and $1000, while a possible bullish surge could drive the market above the moving averages. Meanwhile, the $2400, $2500, and $2600 may further provide resistance levels for the market. Therefore, the Relative Strength Index (14) is moving around 40-level, and staying there may cause the coin to drop more.
Against Bitcoin, the market price is heading towards the south as ETH/BTC is currently trading at 5948 SAT below the 9-day and 21-day moving averages. However, if the Ethereum price slides below the lower boundary of the channel, the next key support could be at 5400 SAT and below.
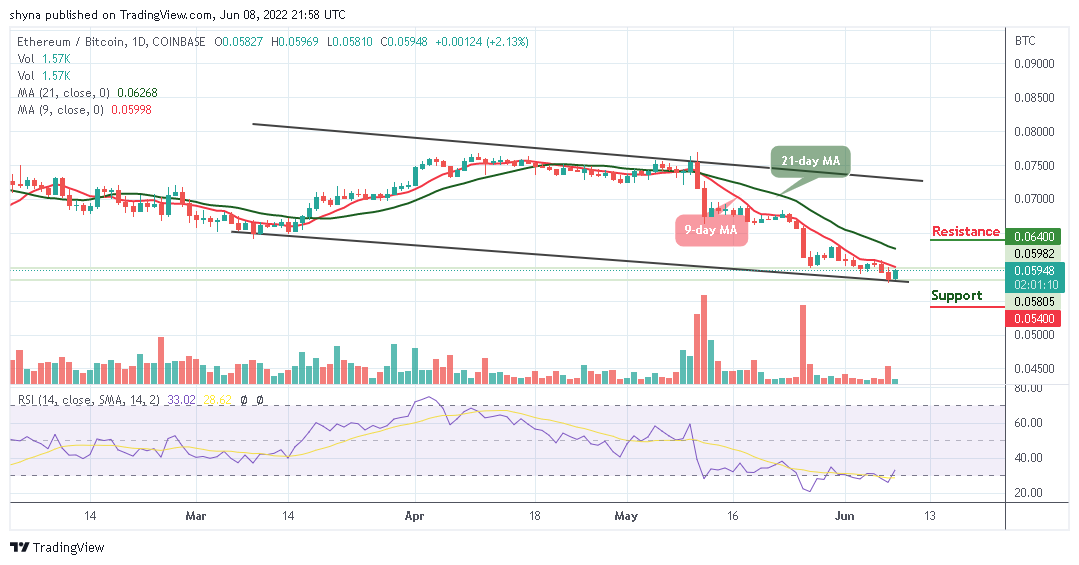
Moreover, any further bullish movement above the moving averages could push the Ethereum price to the nearest resistance level of 6000 SAT. However, the resistance level of 6400 SAT and above could be visited if the technical indicator Relative Strength Index (14) crosses above 40-level, suggesting that the market may follow the bullish movement.
- 90% Claimed Win Rate*
- $300 Min Deposit
- Accepts credit card and Sofort
