

Ethereum price has been trading within a descending trendline, which is a sign of bearishness. Over the last 24 hours, the Ethereum price has been different as the coin registered a 6% appreciation.
As the coin appreciated, it broke outside of the descending channel.
Over the last week, the Ethereum price lost more than 7% of its value. The buyers have entered the market, which has helped Ethereum climb on its chart.
Although buyers are attempting to make a comeback, the sellers continue to drive the price action on the one-day chart.
The $1,400 price mark continues to remain a tough resistance zone for Ethereum price. A break past from the aforementioned support line will help ETH revisit its next price ceiling.
The technical outlook for Ethereum continues to remain bearish at the time of writing. Bitcoin’s price recovery has helped major altcoins pick pace over the last 24 hours.
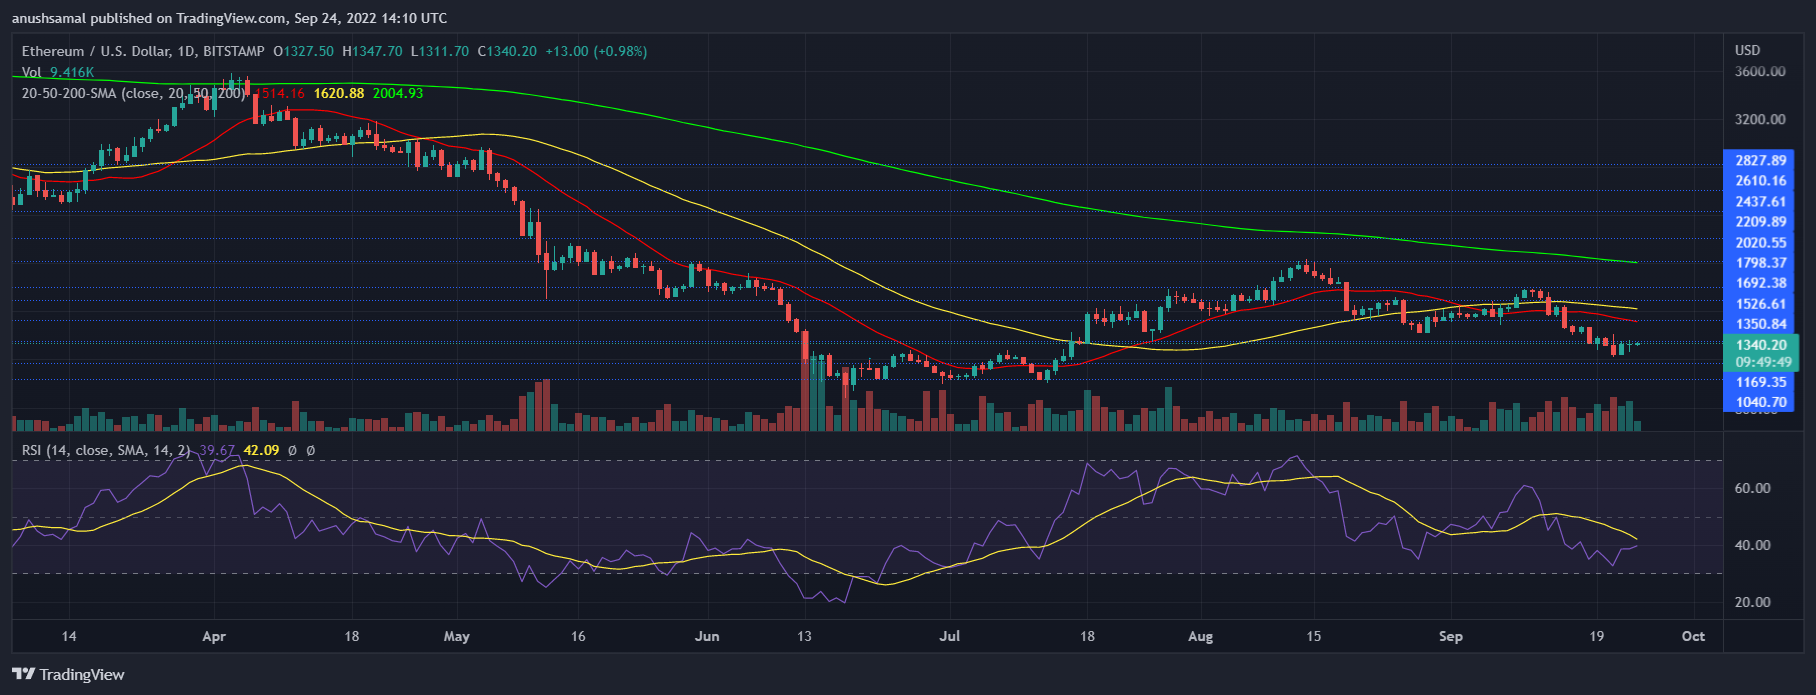
Ethereum Price Analysis: One Day Chart
ETH was trading at $1,340 at the time of writing. In the past 24 hours, the buyers have helped the coin break outside of the descending trendline.
The immediate and strong resistance remained at $1,400. The altcoin has struggled to break past that level over the last couple of weeks.
Once the $1,400 mark is broken, Ethereum can attempt to trade close to $1,700. On the other hand, a fall from the $1,340 price mark will push ETH down to $1,100 and then to the $1,000 level.
The past trading session for Ethereum was green, signifying an increase in the number of buyers.
Technical Analysis
On its chart, ETH was attempting to recover. However, the buyers have remained low at the time of writing. Technical indicators have pointed towards a bearish outlook.
The Relative Strength Index was below the half-line, which also indicated that buyers were fewer in number than sellers.
Ethereum price was below the 20-SMA line, which signified low demand. It also meant that sellers were driving the price momentum in the market.
ETH’s other indicators have also shown that the sellers were in control of the market at the time of writing. The demand for the coin has to go up in order for the coin to touch its next resistance mark.
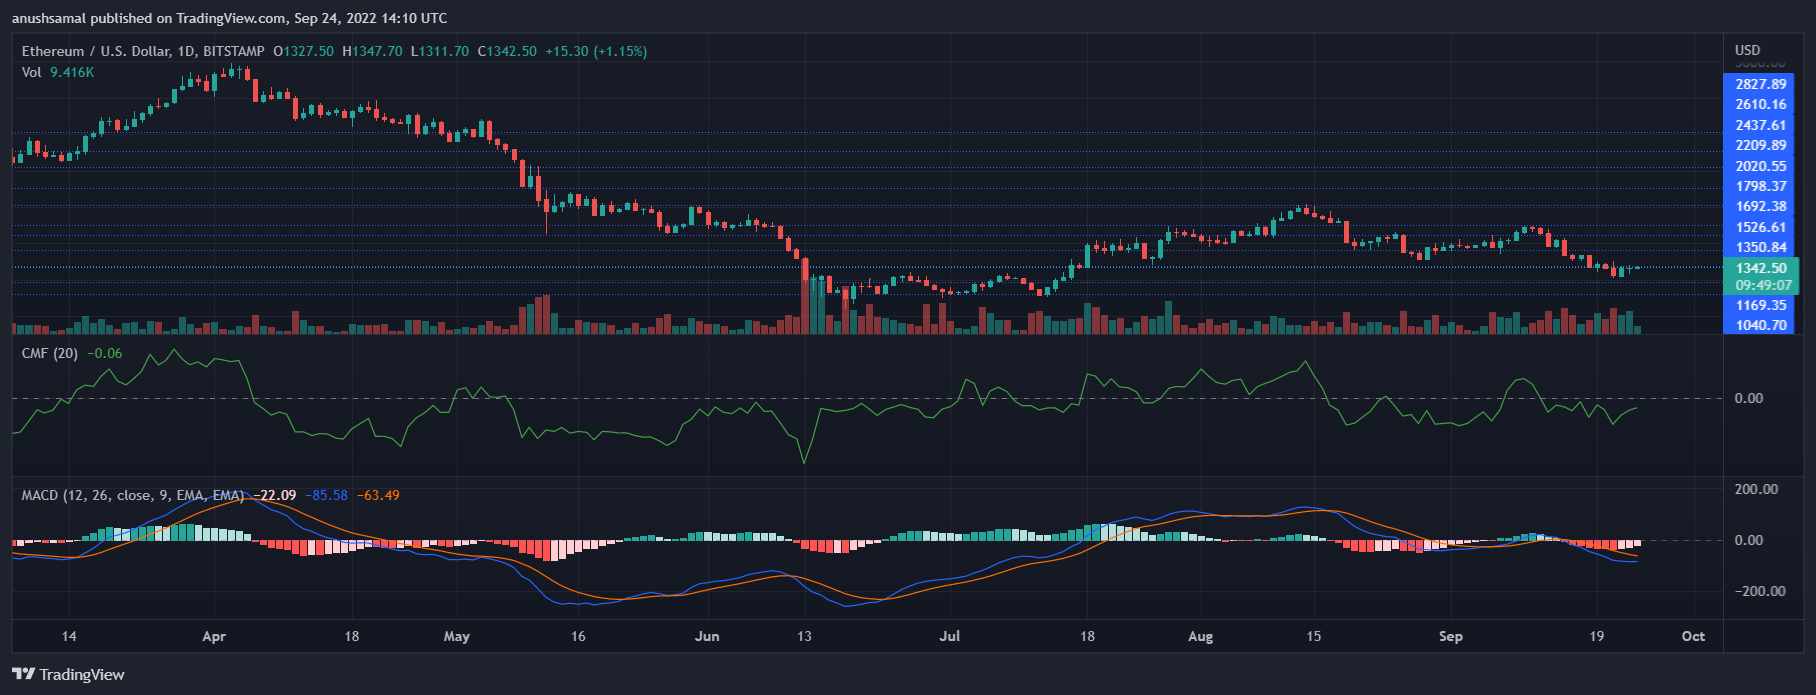
The Moving Average Convergence Divergence indicates the price momentum and overall price action. MACD witnessed a bearish crossover and formed red histograms at the time of writing.
This reading is connected to the sell signal for the coin. The Chaikin Money Flow displays the capital inflows and capital outflows at a given period in time.
The CMF was below the half-line and that points towards low capital inflows, although there was an uptick on the indicator.
