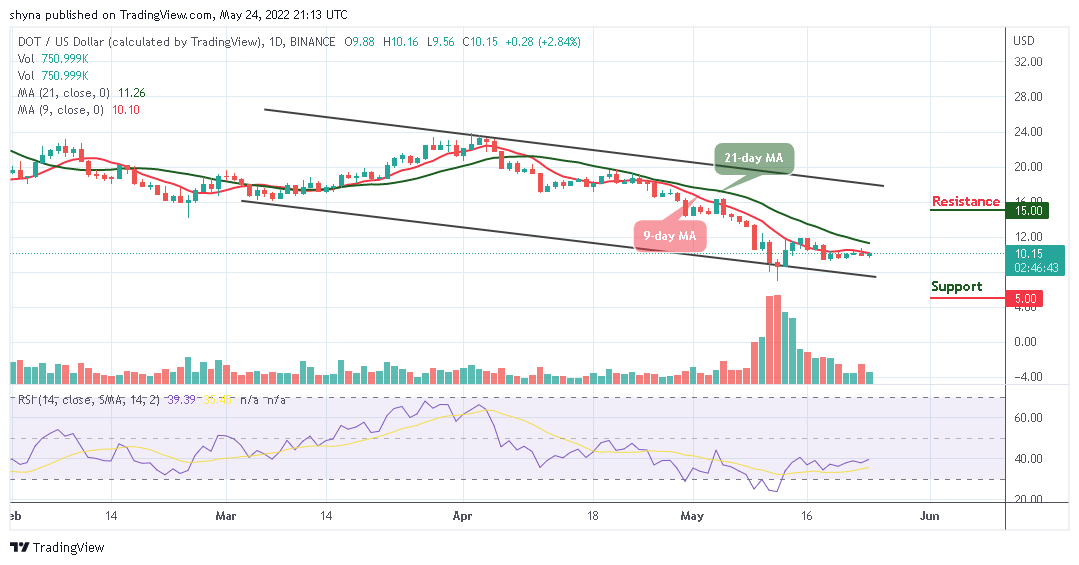
The Polkadot price prediction shows that DOT may cross above the 9-day moving average as the coin may benefit from the buying pressure.
Polkadot Prediction Statistics Data:
Polkadot price now – $10.15
Polkadot market cap – $9.8 billion
Polkadot circulating supply – 987.3 million
Polkadot total supply – 1.1 billion
Polkadot Coinmarketcap ranking – #11
DOT/USD Market
Key Levels:
Resistance levels: $15, $16, $17
Support levels: $5, $4, $3
DOT/USD is trading near the 9-day moving average to hit the resistance level of $11. The coin may continue to rise if the price crosses above the 9-day and 21-day moving averages. Meanwhile, Polkadot could end this week on a better note, as the price could move towards the upper boundary of the channel. Meanwhile, the current performance of the Polkadot is gradual and may inspire move bullish movement.
Polkadot Price Prediction: DOT Price May Shoot to the North
At the time of writing, the Polkadot price faces the upside as the coin moves to cross into the positive side. However, the technical indicator Relative Strength Index (14) is likely to cross above the 40-level, and there is a higher probability that DOT may find resistance at $15, $16, and $17, but slide below the lower boundary of the channel may locate the support levels at $5, $4, and $3 respectively.
DOT/BTC Market: Price May Head to the Upside
Against Bitcoin, DOT is moving to cross above the 9-day moving average but the bulls are yet to push the coin to the upper boundary of the channel today. However, if the Polkadot price crosses above the 9-day and 21-day moving averages, the 3500 SAT could provide an additional resistance level for the next buying pressure as the technical indicator Relative Strength Index (14) moves to cross above the 50-level.
According to the daily chart, after touching the resistance level of 3460 SAT, the DOT price slides a little below the daily high of 3460 SAT but still keeps the price above the 9-day MA. Now, traders may begin to retreat and could touch the nearest support level of 3000 SAT and below. However, if the current level can act as a solid line of defense against any further downtrend; the resistance level of 3900 SAT and above may come into focus.
Looking to buy or trade Polkadot (DOT) now? Invest at eToro!
68% of retail investor accounts lose money when trading CFDs with this provider
Read more:
