When it goes on sale, you buy more.
Klaus Vedfelt/DigitalVision via Getty Images
Get ready for charts, images, and tables because they are better than words. The ratings and outlooks we highlight here come after Scott Kennedy’s weekly updates in the REIT Forum. Your continued feedback is greatly appreciated, so please leave a comment with suggestions.
We’re highlighting one of our new purchases and another share we recently sold.
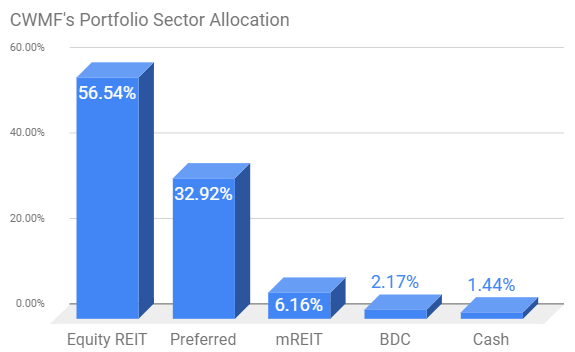
First, the share we sold is an equity REIT, so it rarely gets listed in this series. However, our allocation to the equity REITs was getting huge and we needed to rebalance. Even after our latest trades, we’re still significantly overweight in equity REITs and could continue to rebalance.
The REIT Forum
Some investors will suggest that I’m crazy to invest my portfolio in so few sectors. That would be accurate if I were simply a random investor. However, an analyst should be investing in the shares they cover. Do you really want an analyst who holds 85% index funds telling you what you should buy? I wouldn’t.
So yes, my portfolio is heavily concentrated. But concentrating it allows us to measure our performance using the actual returns across our accounts. In my opinion, that’s the best method for measuring any analyst.
Which Share Did We Drop?
We closed out our position in National Retail Properties (NNN).

The REIT Forum
We’ve lowered our rating to a neutral / hold rating. Why not continue to hold on? I return investors to the chart showing our allocations. Further, as the equity REITs rallied and the other sectors declined, we ended up with an abundance of opportunities in them. Overall, we earned 68% in slightly over 2 years. Not bad, though we certainly had some bigger gains during that period.
I’ll plan to release a more thorough public article on the decision later, but I wanted to take a moment to revise our stance to neutral before I forget.
This trade is not related to National Retail Properties ability to cover their dividend. The payout ratio is reasonably low, and they should not have any difficulty continuing to pay their dividend or generating small annual increases.
What Did We Buy?
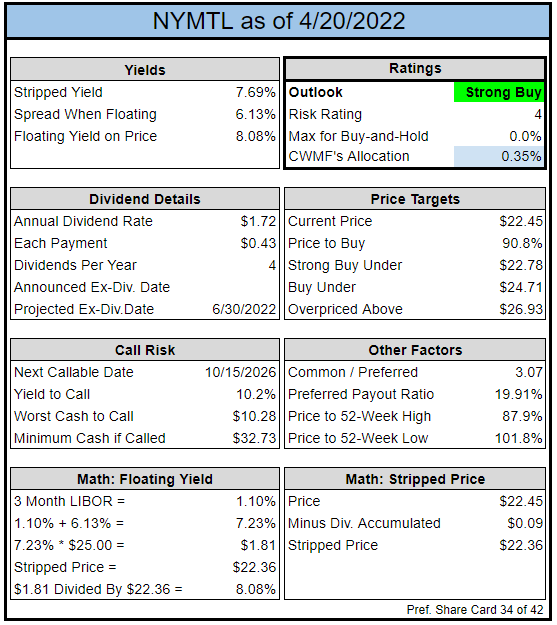
Yesterday I bought shares of NYMTL (NYMTL):
The REIT Forum
Brief Commentary on NYMTL
The price-to-buy was 90.8%. The “Floating Yield on Price” would be excellent already and rates still have some room to climb. I don’t expect to still be holding these shares when call protection runs out on 10/15/2026, but I think investors will come around to realizing the value in the shares and push prices materially higher.
Recently NYMTL has underperformed several other preferred shares, giving us an opportunity to buy into the weakness.
More Details
Since some readers aren’t familiar with our research, I’ll go into a bit more detail about this decision. The spread when shares are floating is 6.13%, which is pretty good. Even for one of the higher risk-rating shares, that’s a solid spread. This important to recognize because the initial fixed-rate dividend is only 6.875%. So, if short-term rates are higher than 0.745%, the dividend rate goes up.
How could NYMT get out of the dividend? Well, they could call shares. But then we’re dealing with a capital gain worth more than a year of dividends. They could suspend dividends, but then they’d have to suspend the common dividends also. That’s not something companies do just to handle a high dividend rate. That would be stupid.
If interest rates plunge before the shares start floating (pretty far off at 10/15/2026), then the dividend rate could go down. But even getting 6.13% with a theoretically 0% short-term rate isn’t all that bad. It’s especially “not that bad” since investors are getting significantly more shares thanks to the discounted price and because this scenario only happens if short-term rates are back at 0%.
At $25.00, I wouldn’t be excited. But below $23.00 the shares are far more appealing. This creates the opportunity for a capital gain as well as a significant yield.
Sure, it only yields 7.52% today. However, if shares aren’t called (requiring a capital gain), that 6.13% spread has the potential to push that yield past 9%. I think that’s going to appeal to quite a few investors.
Account
These trades were placed in our tax-advantaged account. Thankfully, Fidelity is finally allowing investors to buy fixed-to-floating shares online.
Execution
Fidelity
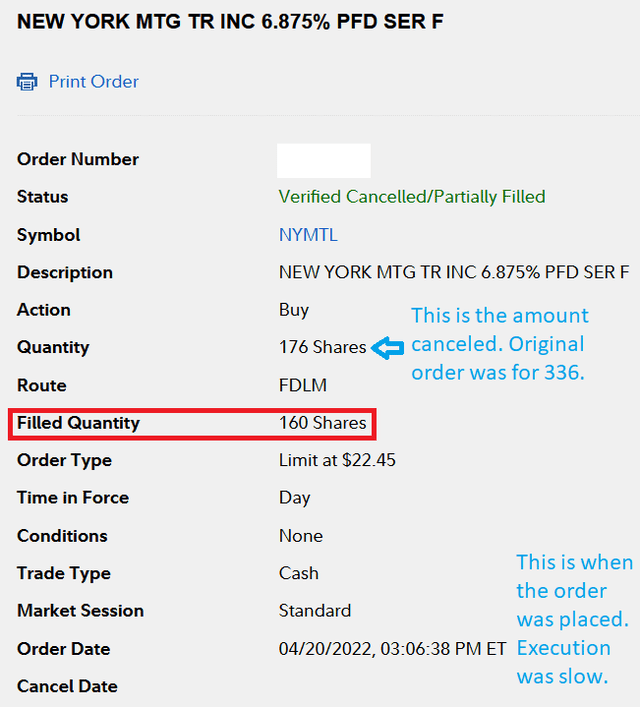
After selling NNN, I promptly used the cash to fund a limit-buy order for NYMTL. Seeing as we’ve highlighted the shares at least twice in subscriber exclusive articles (Portfolio Update and Preferred Share Opportunities), the decision to buy shares when they dipped into the Strong Buy range was pretty simple. We just needed a little bit of free cash.
Note: In addition to closing out the position in NNN, I also transferred some additional cash to the portfolio. It’s not much at $14,000, but it gives us a bit of dry powder to go after some additional bargains. We put that $14,000 to work today, so I’ll highlight it in another article.
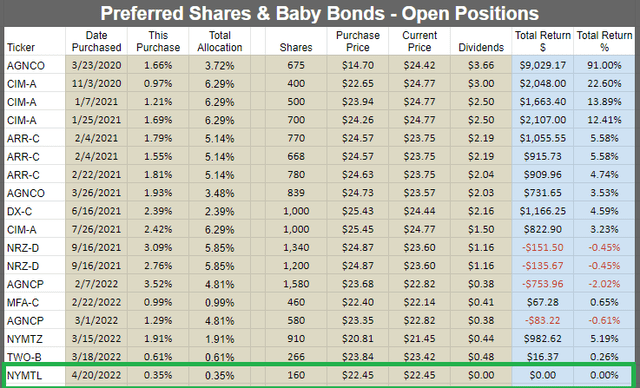
Returns for Open Preferred Share Positions
The next chart shows the returns on all our open preferred share positions through 4/20/2022. However, I need to mention that we’re still actively adding to our allocations. Even today I picked up a few more preferred shares.
The REIT Forum
First Conclusion
After highlighting shares twice and seeing them continue to dip, we took the opportunity to open a position. Since NYMTL has a higher preferred share risk rating, I’m not expecting this to be a very long-term position. The yield is attractive, but I expect to catch a significant capital gain.
Investors looking for lower-risk alternatives (including buy-and-hold investors) might opt to use AGNCP (AGNCP) at $22.82 or AGNCO (AGNCO) at $23.57. Those are two of our other larger positions in preferred shares and both of them are also in the strong buy range with lower risk ratings.
Another Idea
With the market being so wild, we’ve had so many ideas that sometimes I need to pack a few into a single article. This is your reminder to go buy ibonds.
Since some of you are already skimming, here it is in big text:

The REIT Forum
The risk/reward on buying ibonds right now is absurdly attractive. Investors are simply tying up cash for a bit to get an attractive yield. So long as investors have enough cash to keep an emergency fund and max out their IRA / 401k contributions, the ibonds are an excellent choice. After they are redeemable (minimum one-year holding period), they can replace part of the emergency fund since investors can liquidate the position quickly if needed.
I’m not going to regurgitate all the articles explaining the reasons for buying ibonds. There are plenty of those already so I’m just posting a friendly reminder to get it done. They take a day to process and 4/29/2022 is the last business day of the month, so investors should really be placing their order no later than 4/28/2022. Overall, I’d prefer doing it earlier and I’ve already picked up another $20,000 in ibonds with $10,000 for me and $10,000 for my wife (annual limit excluding tax refunds used to purchase ibonds).
Since one of the big to buying ibonds is figuring out how to buy them, I built a guide to buying ibonds with images of every single screen investors see in the process and red circles and arrows showing where to click.
The rest of the charts in this article may be self-explanatory to some investors. However, if you’d like to know more about them you’re encouraged to see our notes for the series.
Stock Table
We will close out the rest of the article with the tables and charts we provide for readers to help them track the sector for both common shares and preferred shares.
We’re including a quick table for the common shares that will be shown in our tables:
Let the images begin!
Residential Mortgage REIT Charts
Note: We are modeling some significant changes to BV since 12/31/2021 and some management teams have already publicly indicated a material change in BV per share. The chart for our public articles uses the book value per share from the latest earnings release. Current estimated book value per share is used in reaching our targets and trading decisions. It is available in our service, but those estimates are not included in the charts below.
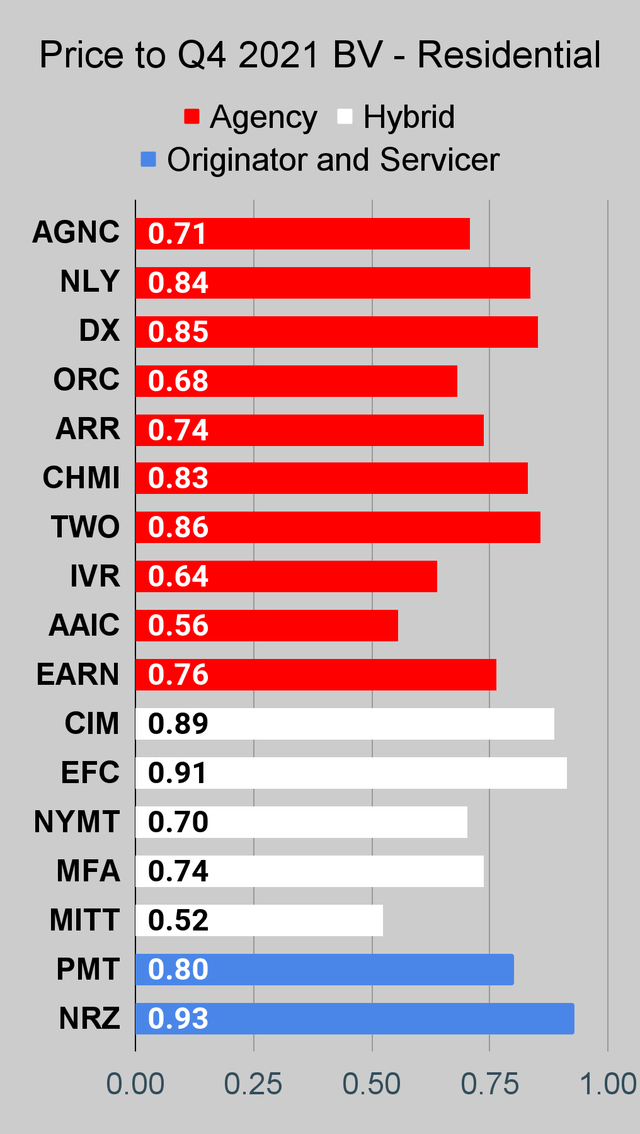 The REIT Forum |
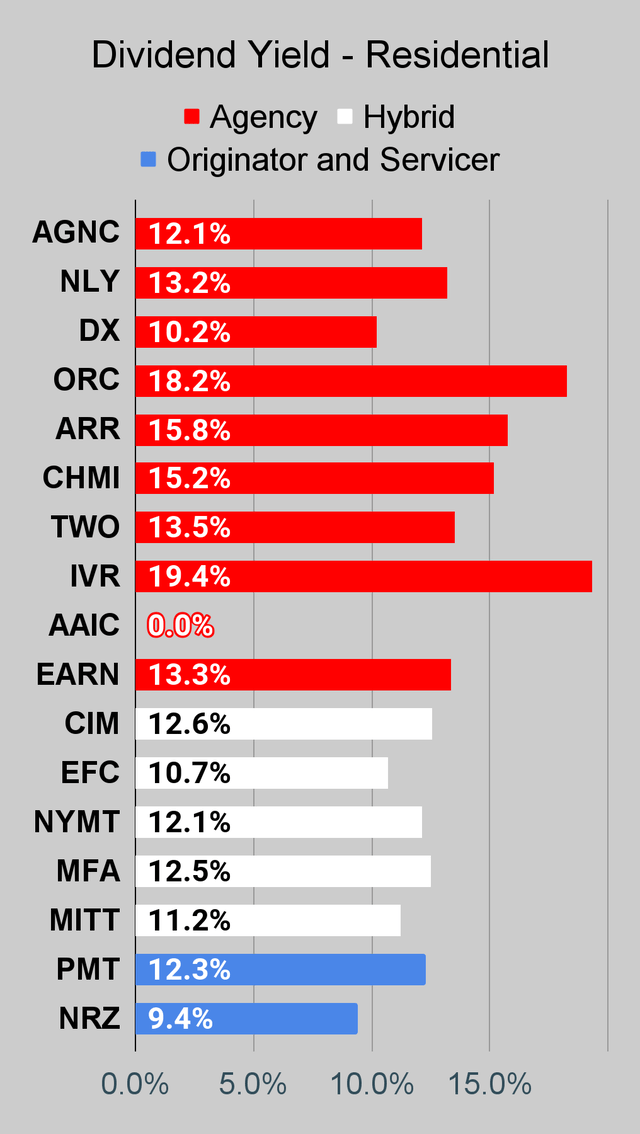 The REIT Forum |
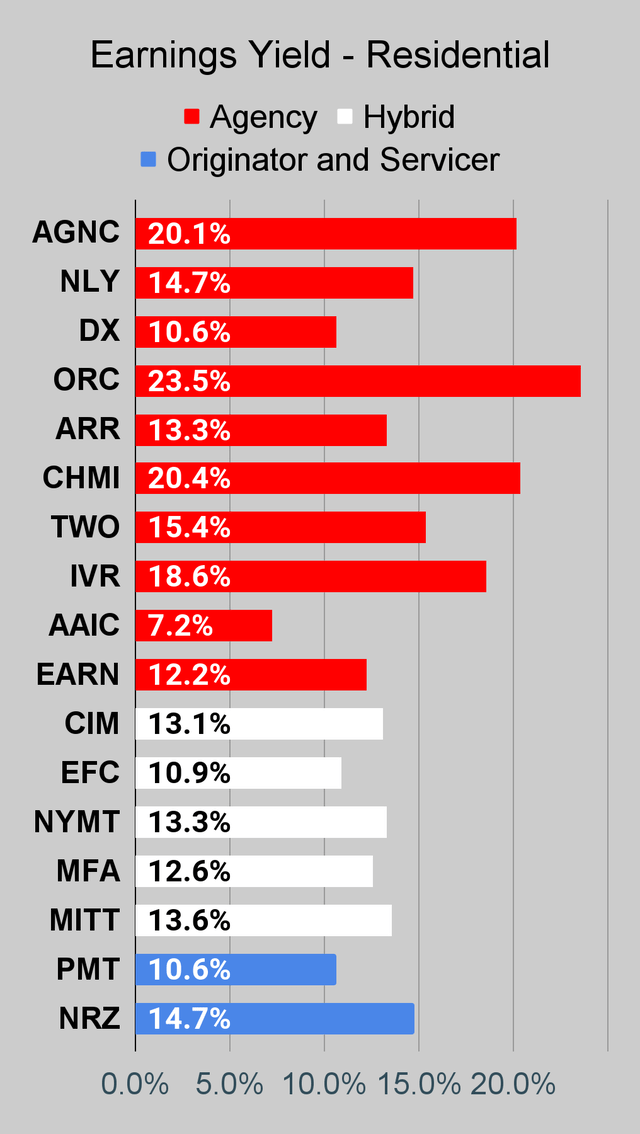 The REIT Forum |
Source: The REIT Forum
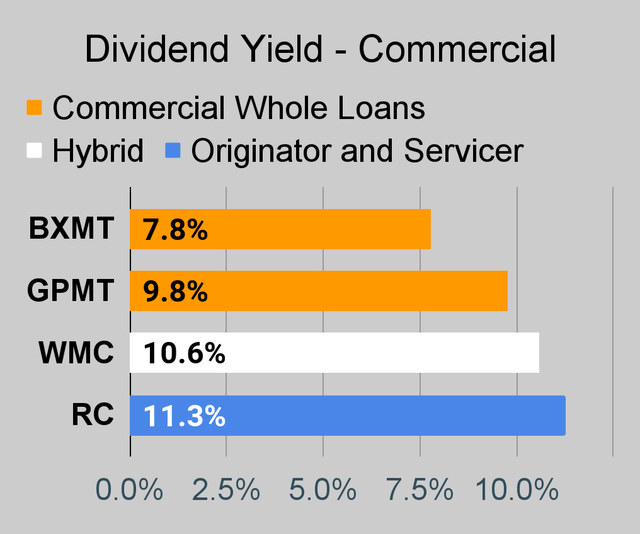
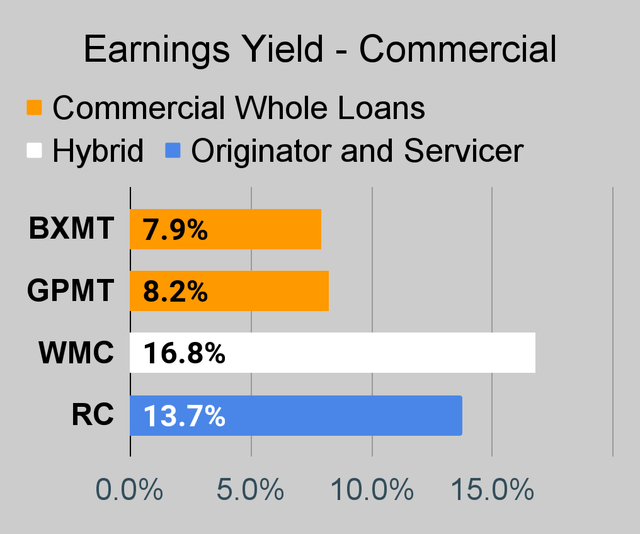
Commercial Mortgage REIT Charts
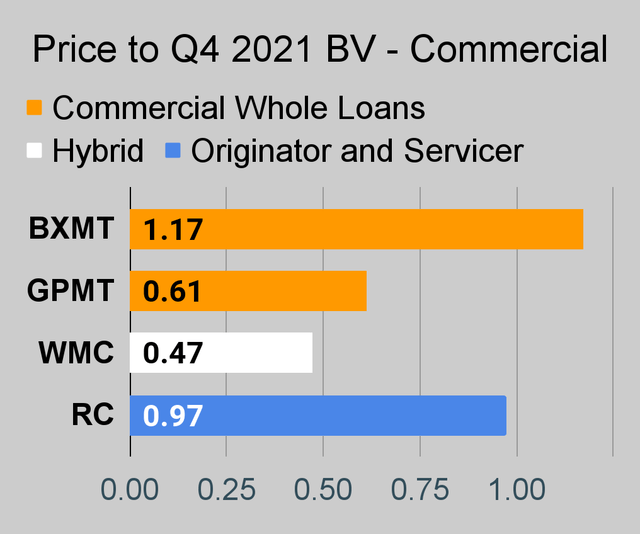 The REIT Forum |
 The REIT Forum |
 The REIT Forum |
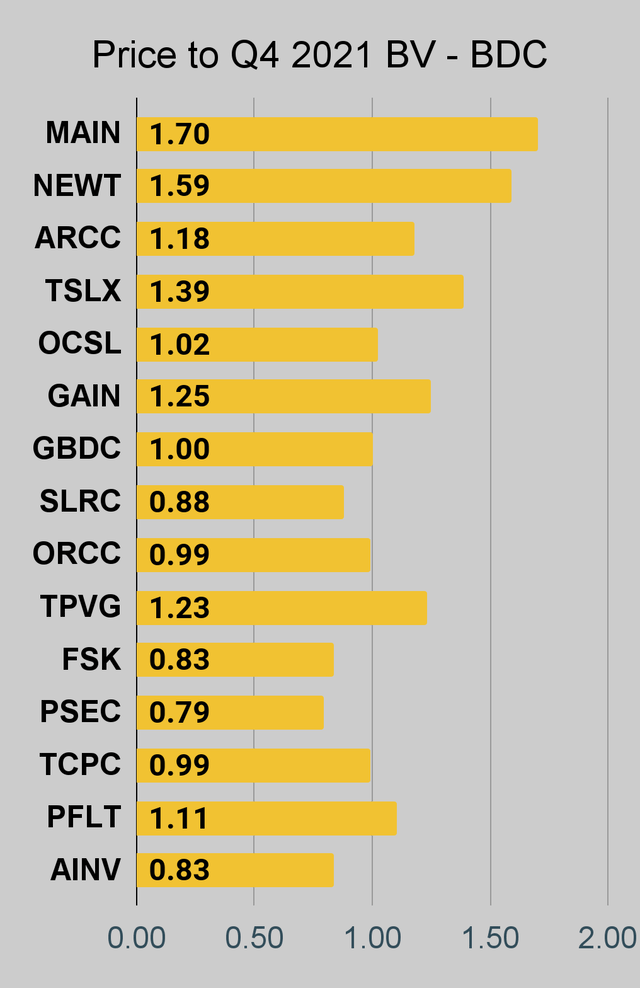
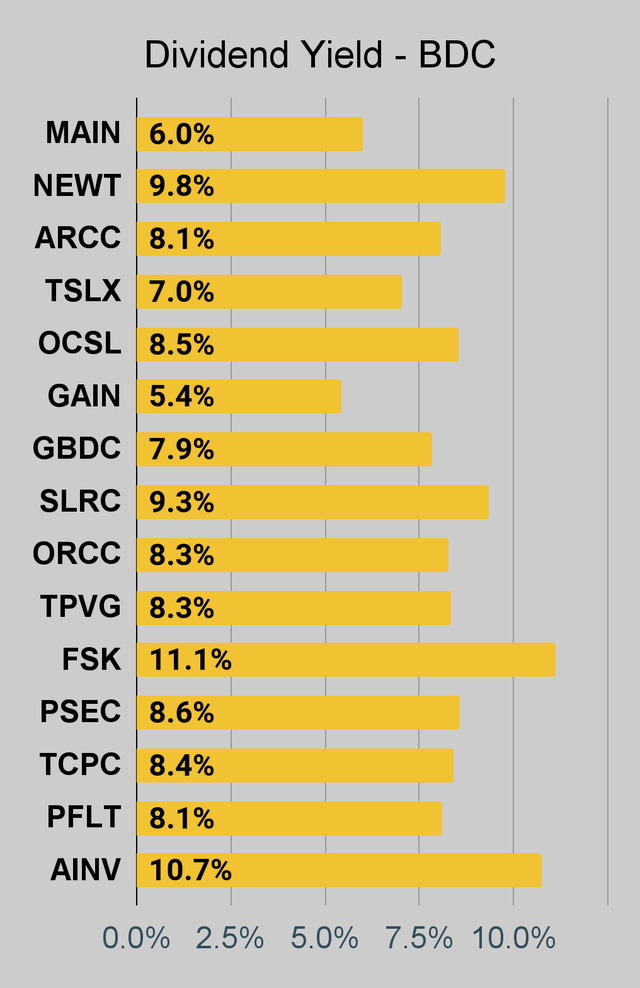
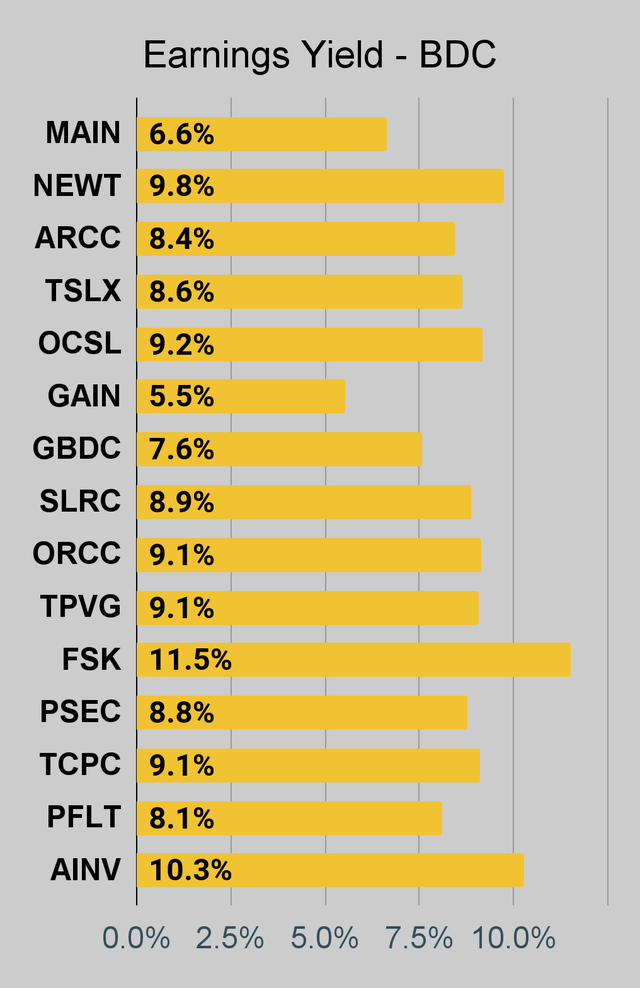
BDC Charts
 The REIT Forum |
 The REIT Forum |
 The REIT Forum |
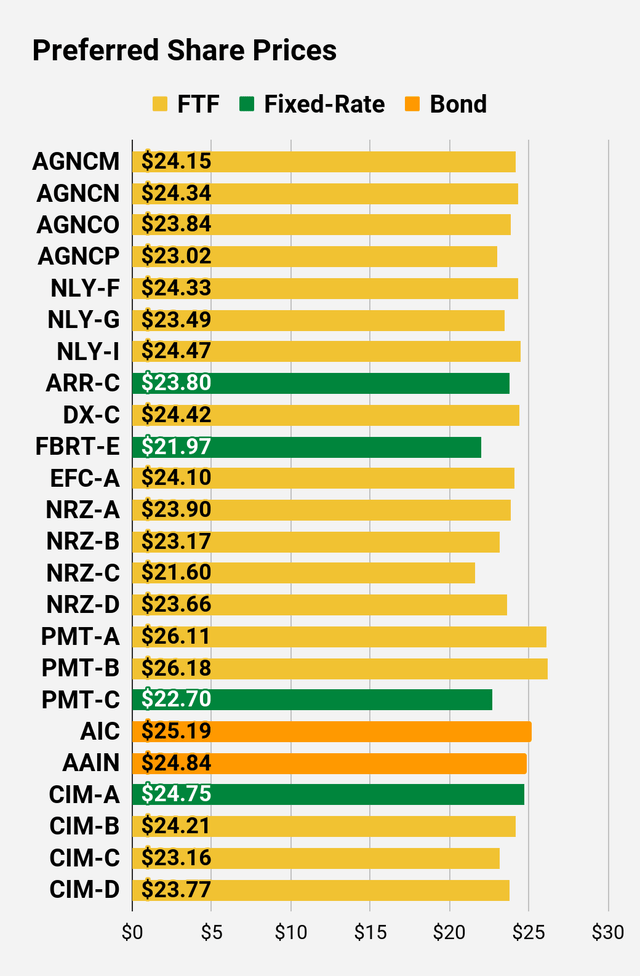
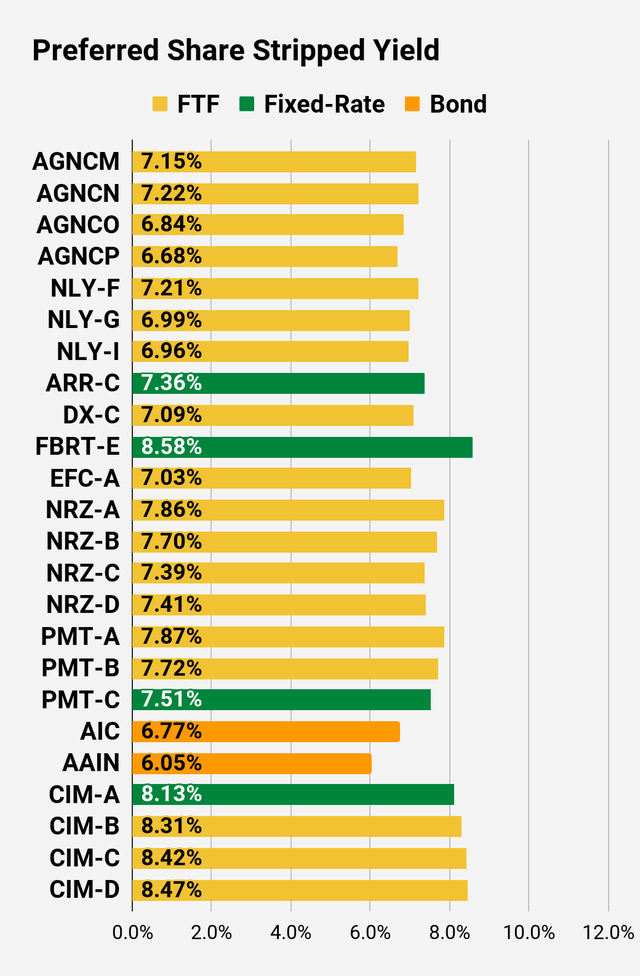
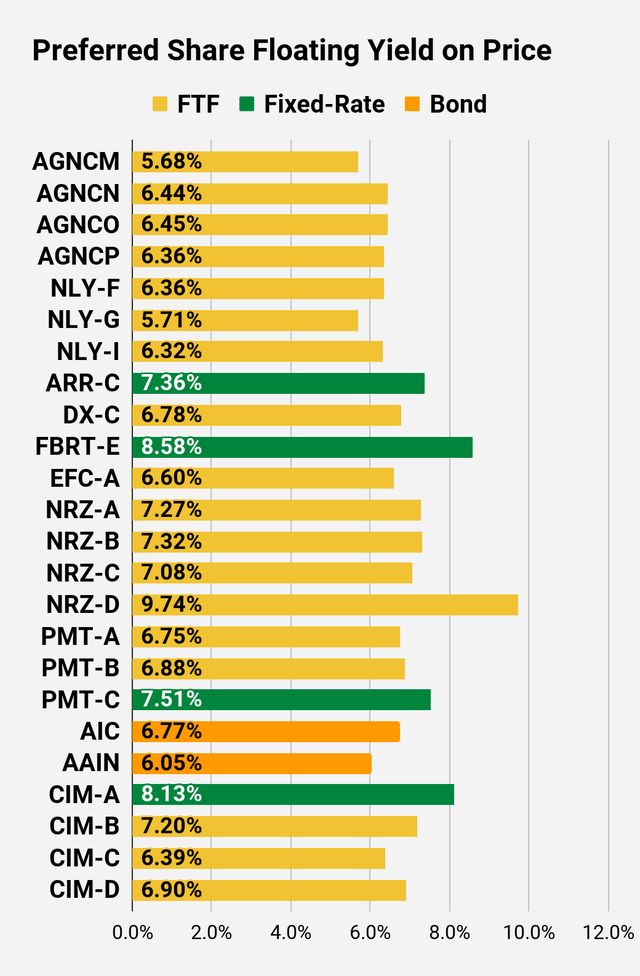
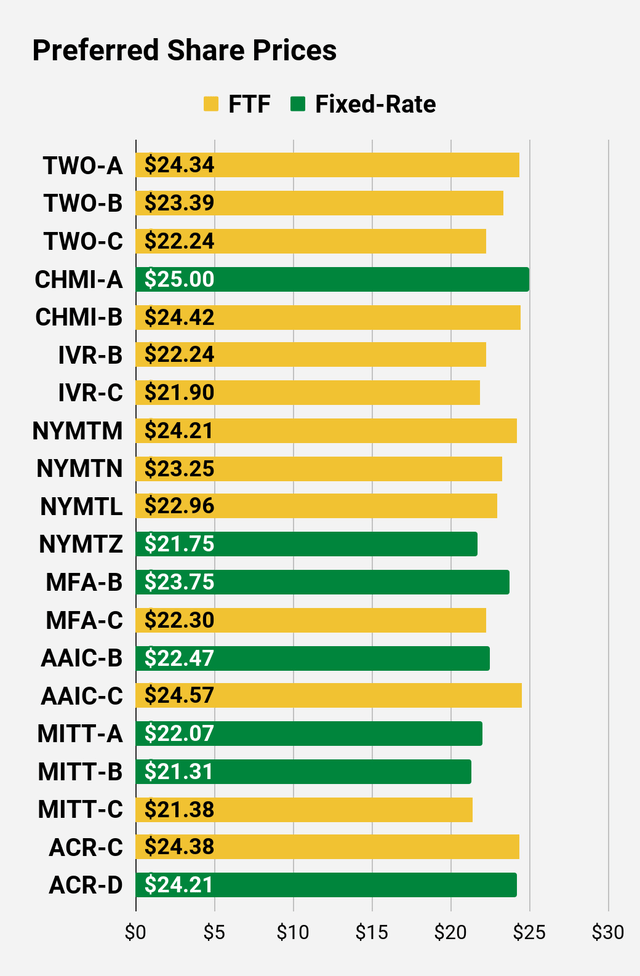
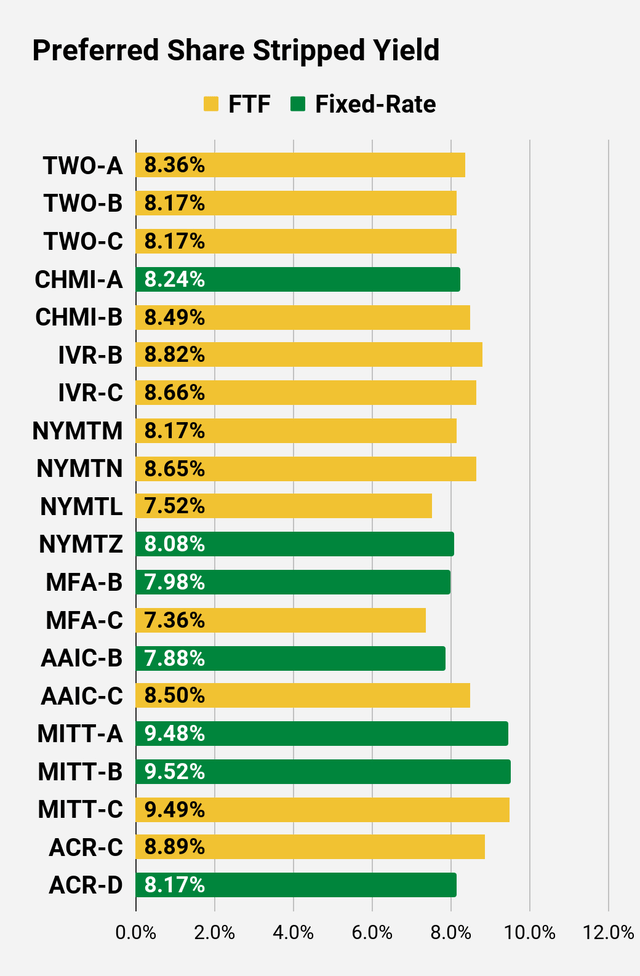
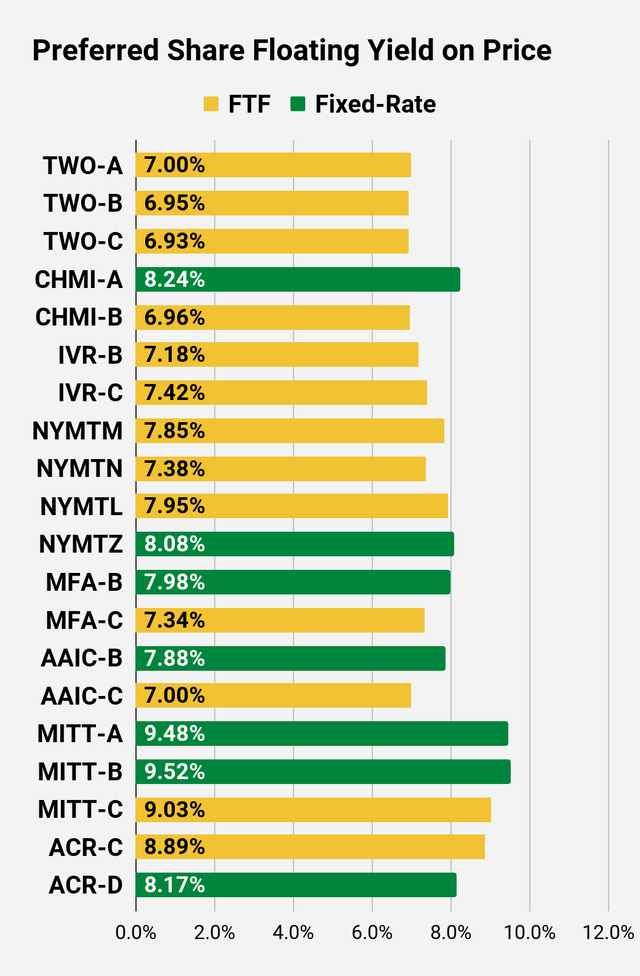
Preferred Share Charts
 The REIT Forum |
 The REIT Forum |
 The REIT Forum |
 The REIT Forum |
 The REIT Forum |
 The REIT Forum |
Preferred Share Data
Beyond the charts, we’re also providing our readers with access to several other metrics for the preferred shares.
After testing out a series on preferred shares, we decided to try merging it into the series on common shares. After all, we are still talking about positions in mortgage REITs. We don’t have any desire to cover preferred shares without cumulative dividends, so any preferred shares you see in our column will have cumulative dividends. You can verify that by using Quantum Online. We’ve included the links in the table below.
To better organize the table, we needed to abbreviate column names as follows:
- Price = Recent Share Price – Shown in Charts
- BoF = Bond or FTF (Fixed-to-Floating)
- S-Yield = Stripped Yield – Shown in Charts
- Coupon = Initial Fixed-Rate Coupon
- FYoP = Floating Yield on Price – Shown in Charts
- NCD = Next Call Date (the soonest shares could be called)
- Note: For all FTF issues, the floating rate would start on NCD.
- WCC = Worst Cash to Call (lowest net cash return possible from a call)
- QO Link = Link to Quantum Online Page
Second Batch:
Strategy
Our goal is to maximize total returns. We achieve those most effectively by including “trading” strategies. We regularly trade positions in the mortgage REIT common shares and BDCs because:
- Prices are inefficient.
- Long-term, share prices generally revolve around book value.
- Short-term, price-to-book ratios can deviate materially.
- Book value isn’t the only step in analysis, but it is the cornerstone.
We also allocate to preferred shares and equity REITs. We encourage buy-and-hold investors to consider using more preferred shares and equity REITs.
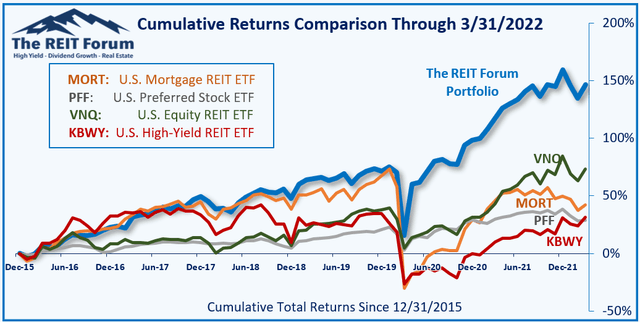
Performance
We compare our performance against 4 ETFs that investors might use for exposure to our sectors:
The REIT Forum
The 4 ETFs we use for comparison are:
|
Ticker |
Exposure |
|
MORT |
One of the largest mortgage REIT ETFs |
|
PFF |
One of the largest preferred share ETFs |
|
VNQ |
Largest equity REIT ETF |
|
KBWY |
The high-yield equity REIT ETF. Yes, it has been dreadful. |
When investors think it isn’t possible to earn solid returns in preferred shares or mortgage REITs, we politely disagree. The sector has plenty of opportunities, but investors still need to be wary of the risks. We can’t simply reach for yield and hope for the best. When it comes to common shares, we need to be even more vigilant to protect our principal by regularly watching prices and updating estimates for book value and price targets.
Ratings:
- Bullish on preferred share NYMTL
- Neutral on NNN
- Go buy ibonds if you haven’t yet


