

The Bitcoin price prediction shows that BTC is following the bearish movement as the price drops to touch the $28,564 daily low.
Bitcoin Prediction Statistics Data:
- Bitcoin price now – $28,790
- Bitcoin market cap – $548.2 billion
- Bitcoin circulating supply – 19.0 million
- Bitcoin total supply – 19.0 million
- Bitcoin Coinmarketcap ranking – #1
BTC/USD Long-term Trend: Bearish (Daily Chart)
Key levels:
Resistance Levels: $35,000, $37,000, $39,000
Support Levels: $24,000, $22,000, $20,000
BTC/USD is experiencing an unexpected selloff as the market price slides below the 9-day moving average. The first digital asset drops after touching the daily high at $29,355. However, a reversal may play out, which may send the king coin above the opening price of $29,166 level if the bulls step back into the market.
Bitcoin Price Prediction: Where is Bitcoin (BTC) Going Next?
At the time of writing, the technical indicators reveal that the Bitcoin price is following a bearish movement. The Relative Strength Index (14) Keeps moving below 40-level. This could mean that there is still room that may be explored by the bears. Therefore, BTC/USD may stay at the downside if the market price crosses below the channel.

On the upside, recovery may not come into focus, but any attempt to move towards the upper boundary of the channel may allow the king coin to move and hit the resistance levels of $35,000, $37,000, and $39,000. Meanwhile, an increase in selling pressure could force the Bitcoin price to follow a bearish path which could locate the support levels at $24,000, $22,000, and $20,000.
BTC/USD Medium-Term Trend: Ranging (4H Chart)
On the 4-hour chart, the Bitcoin price has been ranging as the coin remains below the 9-day and 21-day moving averages. However, the Bitcoin price is likely to return to the bull market if the 9-day MA crosses above the 21-day MA, and higher resistance could be located at $29,500 and above.
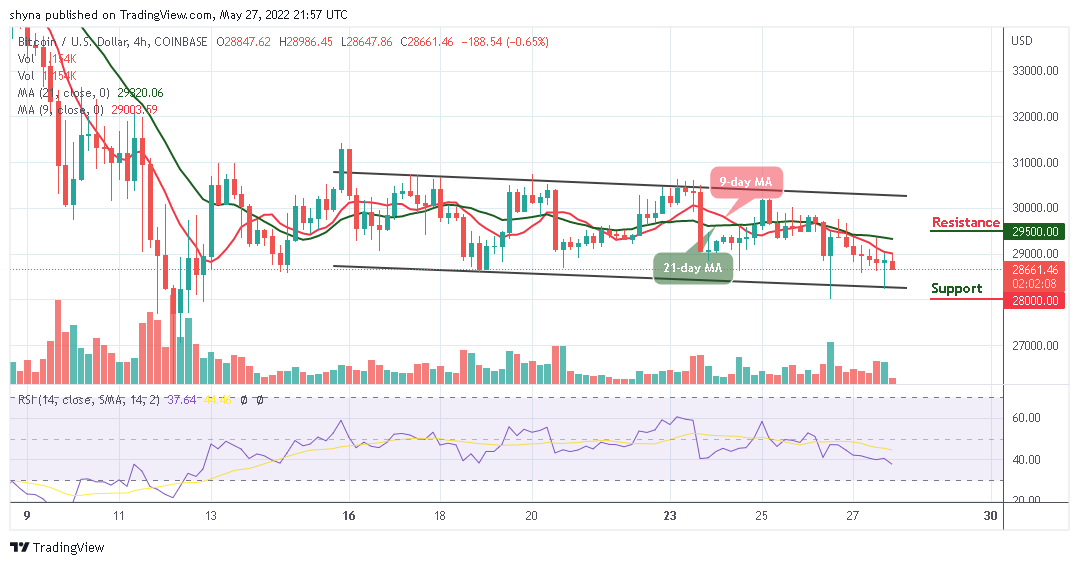
Similarly, if the price drops below the lower boundary of the channel, the support level of $28,500 may not be able to hold the selling pressure as the Relative Strength Index (14) crosses below the 40-level. Any further bearish movement may hit the support level of $28,000 and below.
eToro – Our Recommended Bitcoin Platform
- Regulated by the FCA, ASIC and CySEC
- Buy Bitcoin with Bank transfer, Credit card, Neteller, Paypal, Skrill
- Free Demo Account, Social Trading Community – 20 Million Users
- Free Bitcoin Wallet – Unlosable Private Key
- Copytrade Winning Bitcoin Traders – 83.7% Average Yearly Profit
68% of retail investor accounts lose money when trading CFDs with this provider.
Read more:
