Australian Dollar Talking Points
AUD/USD trades back above the September low (0.6363) as it carves a series of higher highs and lows, and the exchange rate may attempt to test the 50-Day SMA (0.6593) if it clears the opening range for October.
AUD/USD to Test 50-Day SMA on Break Above Monthly Opening Range
AUD/USD trades to a fresh weekly high (0.6511) following the limited reaction to the larger-than-expected rise in Australia’s Consumer Price Index (CPI), with the exchange approaching the monthly high (0.6547) as the Greenback continues to depreciate against all of its major counterparts.
However, the update to the US Personal Consumption Expenditure (PCE) Price Index may influence the near-term outlook for AUD/USD as the core rate, the Federal Reserve’s preferred gauge for inflation, is expected to increase to 5.2% in September from 4.9% per annum the month prior.
Another uptick in the core PCE may force the Federal Open Market Committee (FOMC) to retain its current approach in combating inflation as the Summary of Economic Projections (SEP) reflects a steeper path for US interest rates, and speculation for another 75bp Fed rate hike may curb the recent advance in AUD/USD as the Reserve Bank of Australia (RBA) shows little interest in carrying out a restrictive policy.

In turn, AUD/USD may face headwinds ahead of the next RBA meeting on November 1 as Governor Philip Lowe and Co. are anticipated to deliver another 25bp rate hike, but a break above the monthly opening range may continue to alleviate the tilt in retail sentiment like the behavior seen earlier this year.

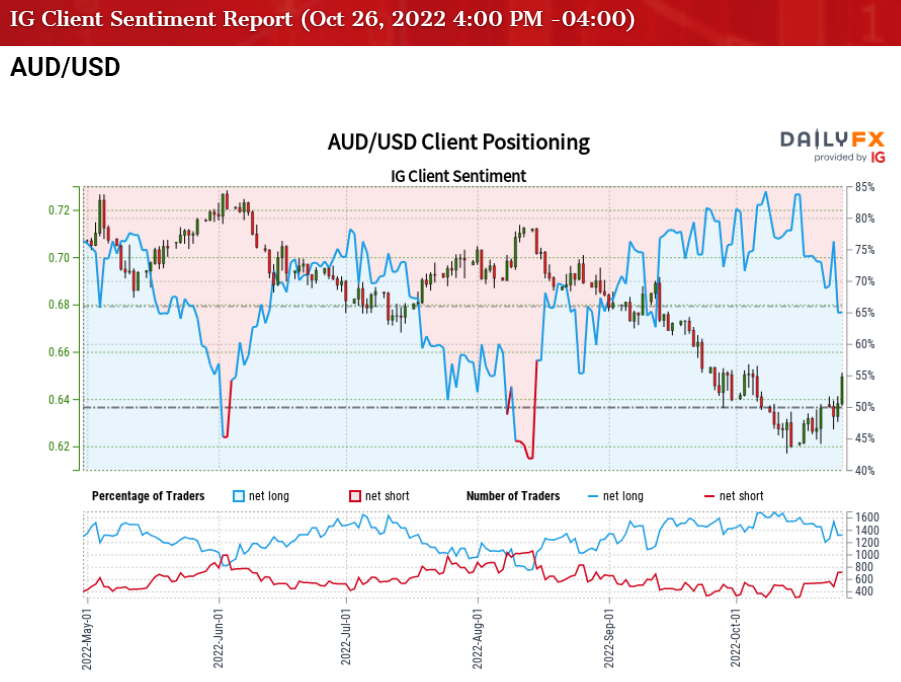
The IG Client Sentiment (IGCS) report shows 60.77% of traders are currently net-long AUD/USD, with the ratio of traders long to short standing at 1.55 to 1.
The number of traders net-long is 10.57% lower than yesterday and 21.03% lower from last week, while the number of traders net-short is 11.87% higher than yesterday and 37.09% higher from last week. The drop in net-long position comes as AUD/USD trades to a fresh weekly high (0.6511), while the jump in net-short interest has helped to alleviate the crowding behavior as 68.77% of traders were net-long the pair last week.
With that said, AUD/USD may attempt to test the 50-Day SMA (0.6593) if it clears the opening range for October, but the exchange rate may mirror the price action from last month should it track the negative slope in the moving average.
Introduction to Technical Analysis
Market Sentiment
Recommended by David Song
AUD/USD Rate Daily Chart

Source: Trading View
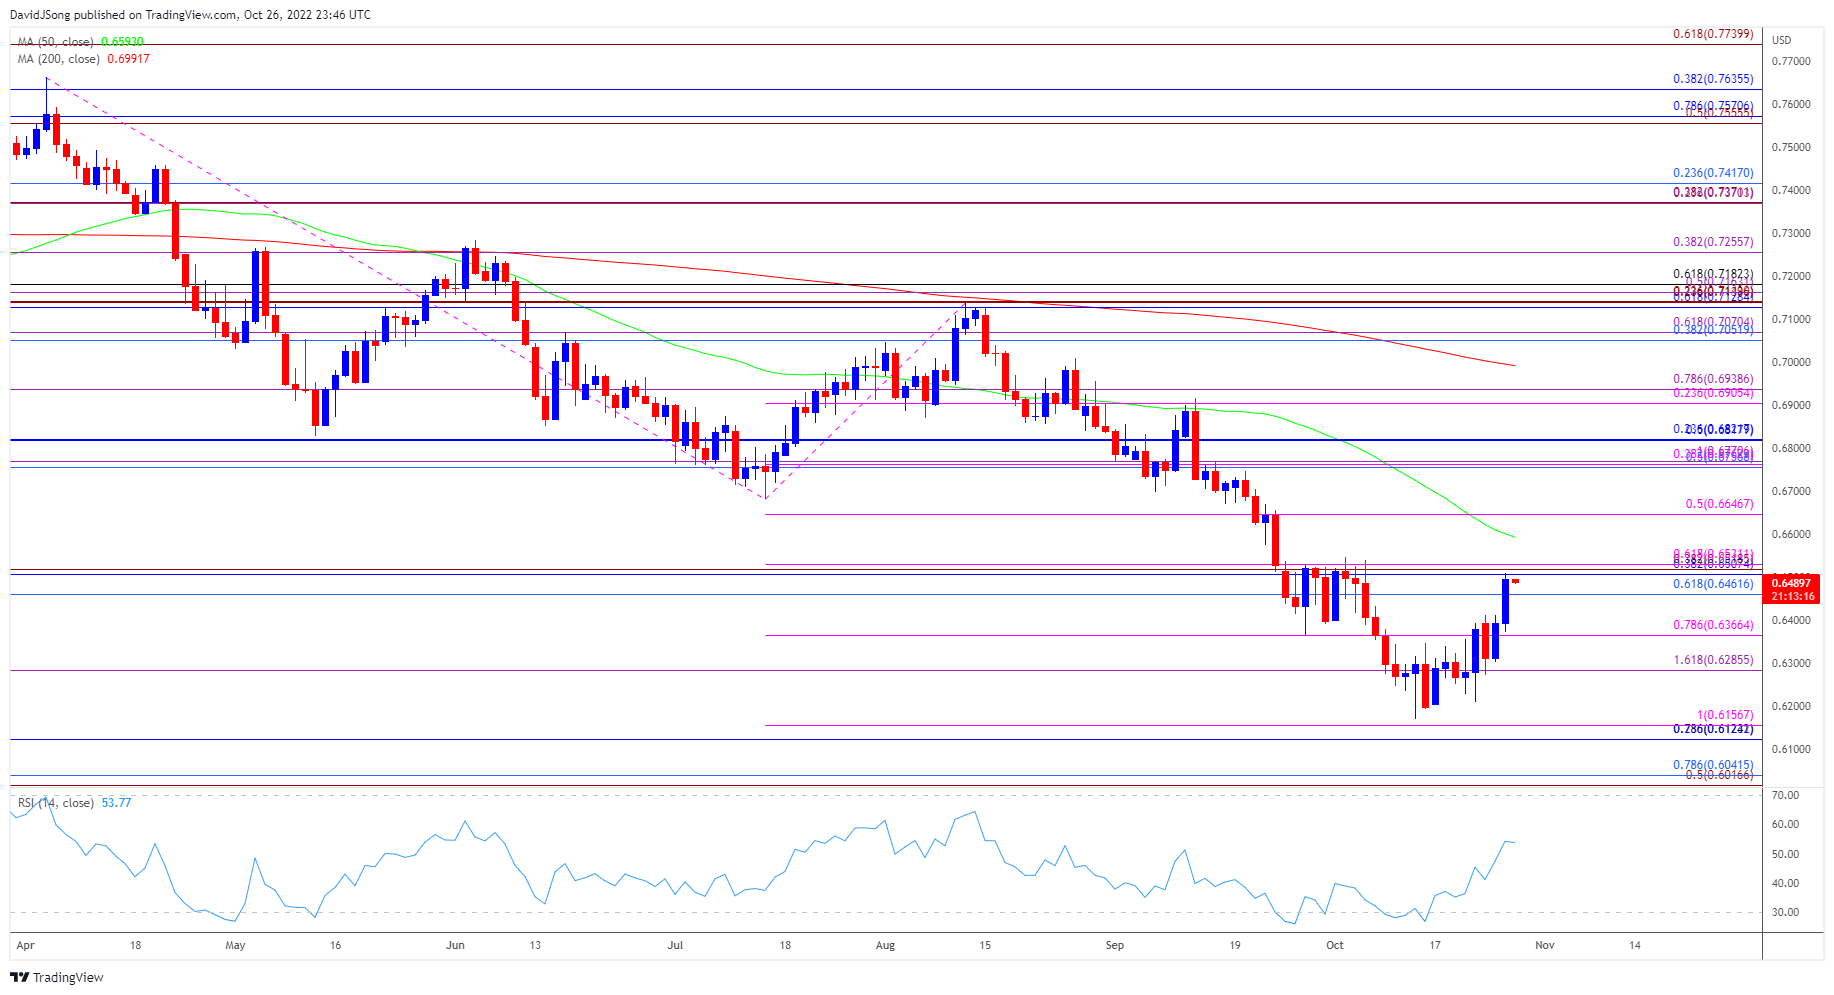
- AUD/USD may attempt to break out of the opening range for October as it approaches the monthly high (0.6547), with a break/close above the Fibonacci overlap around 0.6460 (61.8% retracement) to 0.6530 (61.8% expansion) raising the scope for a test of the 50-Day SMA (0.6593).
- A move above the moving average may push AUD/USD towards the 0.6650 (50% expansion) region, but the exchange rate may track the negative slope in the moving average if it fails to clear the monthly opening range.
- Lack of momentum to break/close above the overlap around 0.6460 (61.8% retracement) to 0.6530 (61.8% expansion) may keep AUD/USD within the October range, with a move below 0.6370 (78.6% expansion) bringing the 0.6290 (161.8% expansion) area back on the radar.
- Failure to defend the 0.6120 (78.6% retracement) to 0.6160 (100% expansion) region opens up the 0.6020 (50% expansion) to 0.6040 (78.6% retracement) zone, with the next area of interest coming in around the April 2020 low (0.5980).
Trading Strategies and Risk Management
Becoming a Better Trader
Recommended by David Song
— Written by David Song, Currency Strategist
Follow me on Twitter at @DavidJSong


